Election 2016, U.S. Needs a Productivity Boost

“Entitlement programs and regulation are gradually crowding out capital investment, productivity, and follow on standards of living.”

Alan Greenspan

What’s the Economy Telling us about Election 2016?

This week we learned U.S. productivity rose annualized 3.1% (forecast was 2.1%) after revised 0.2% drop.

The productivity data represents a much needed break from the longest consecutive string of declines since 1979. As the election gets nearer the implications of a fundamental shift in business operating conditions are massive.

Pick up our latest report, trading ideas here.

U.S. Non-Farm Productivity Year over Year

unnamed-31

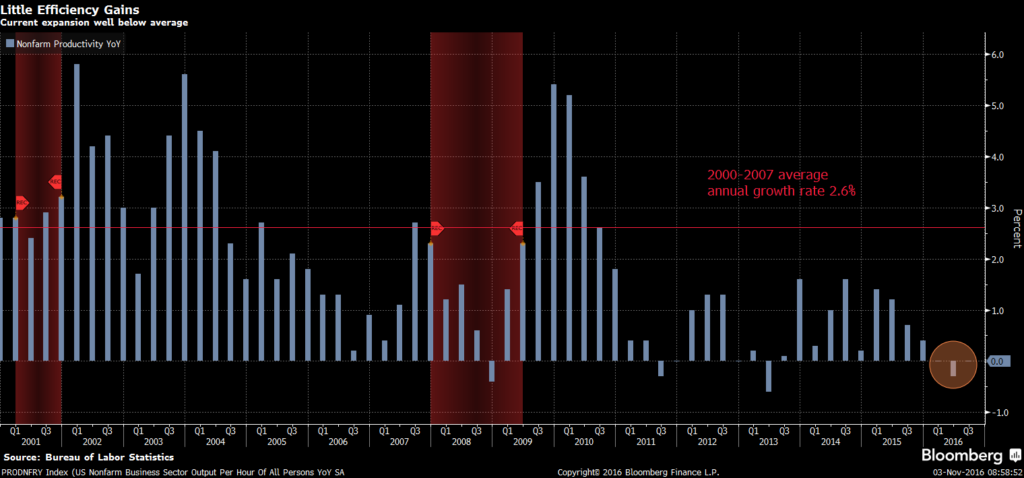
An ugly picture, an economic expansion well below average.  Over the last five years, annual productivity gains averaged 0.6%, the weakest since 1978-1982.  Disappointing U.S. productivity growth has been embarrassing FOMC policy makers since the recovery began in 2009. 

Fed’s Balance Sheet Shooting Blanks

fed-bal-sheet

Their balance sheet has exploded since 2009 with mixed results. Productivity gains are a key determinant for an economy’s ability to grow. Total factor productivity, a wide measure of the efficiency with which an economy uses its inputs, averaged just 0.29% in the past 12 quarters, according to the San Francisco Fed.

“Business investment has been surprisingly weak”

Fed Chair Janet Yellen, September 2016

Election 2016, Set Her Free, U.S. Economy is Caged

It’s clear to us, the election and regulatory uncertainty, coupled with the entitlement debt crowd-out has U.S. businesses in a straight jacket.  They will NOT invest, created meaningful job growth.  This should all change late next year, give American business owners visibility and we’ll all be surprised at the upside potential.

The U.S. economy is a caged gorilla in the chains or regulatory, tax burden, and entitlement crowd out, set her free.

Don’t miss our next trade idea. Get on the Bear Traps Report Today, click here

Crowdout US Productivity Growth*

2010-16: 0.3%
Bush: 2.2%
Clinton: 2.3%
Reagan: 2.2%

*annual % change in GDP per hrs worked

US Gov Entitlement Transfers % of Total Budget Outlays

2016: 74%
2000 57%
1990 49%
1980 44%
1970 38%
1960 28%
1950 26%
1940 12%

CBO data


Don’t miss our next trade idea. Get on the Bear Traps Report Today, click here


Facebooktwittergoogle_plusredditlinkedintumblrmail

Facebooktwitterrssyoutube

U.S. Jobs Report; What You Need to Know

Join our Larry McDonald on CNBC’s Trading Nation today at 2:30pm.

“Credit risk will VETO the Fed’s desired policy path in 2016, we don’t see a rake hike before the election.”

Bear Traps Report, December 2015

As We Stressed to Clients in January, Credit Risk Driving the Fed Bus, NOT Wages and Jobs

We have a 4.9% unemployment rate in the United States, stable prices with inflation PCE at 1.7%, but Donald Trump is surging in the polls? Millions of people in middle America have been cut out of the current state of the U.S. economy.

In 2007, there were 122 million full time employed Americans, today we have 124 million. That’s an additional 2 million full time jobs over the last eleven years with a U.S. population 26 million HIGHER, per Bloomberg data.

Most people scream demographics to explain this decay in American full time employment.  Wrong.  Research from Goldman Sachs shows the aging population in the USA only accounts for 28% of the plunge in the full time employed over the last decade.

U.S. Full Time Jobs

1990s +14m

2000: 112.1m
1990: 97.9m

BLS data

Economic growth? U.S. GDP is averaging 2.1% GDP growth over the last 8 years, 1.5% this year.  Barack Obama will be the first president on record NOT to have one year with 3% growth, that’s never happened in the history of the USA.

What to Expect from the Fed?

Wall St. has gone from telling us to expect RATE CUTS back in June to a virtually certainty of a December rate hike today. Once again, they’re missing the most important point. Credit Risk has been driving the Fed bus in 2016, NOT jobs.

The October Jobs number came in a bit below consensus at 161k vs 173k median forecast. Our model was looking for 155k.

The unemployment rate did tick back down to 4.9% vs 5% in the previous number. The three month average for job growth is now 176,000. A number that will give the Fed great confidence going into their December meeting. However, it is down from the Sept 3 month average of 206,000.

To get our model, join us here.

What’s Behind the Strength? Government Hiring

image-41
And don’t forget the Chicago Guys! Government hiring was +19k in October. The kicker was government hiring saw a massive upward revision. Hiring was revised in BOTH August and September, NET +35k! (+12k to +47k!). The August government job number went from 23k to 44k and the September number was moved higher by 14k, from -3k to 11k.

Don’t miss our next trade idea. Get on the Bear Traps Report Today, click here

Sectors of strength included; GOVERNMENT hiring, servicing related industries, health care and social assistance +39.1k and education +52k, these have been bright spots in recent reports as well.

The Question is Does it Matter?

This indicator is pointing toward a Trump win. With this contested election just four days away, the market is worried about bigger issues. Election and Market risk is driving the Fed bus. A rate hike in December is off the table with a Trump win next week.

peso-1-m
Market participants are hedging their Trump risk. The 1 month volatility of Dollar/Mexican Peso suggests this election is very close and markets are nervous. Until Tuesday passes, this is a key metric we are watching as barometer of Trump risk.

Clinton Firewall Breach

There’s been a potential breach of Hillary Clinton’s electoral firewall. And it’s come in New Hampshire, a state that we said a couple of weeks ago could be a good indicator of a Donald Trump comeback because of its large number of swing voters. Three new polls of New Hampshire released today showed a tied race, Trump ahead by 1 percentage point and Trump up by 5. There are some qualifications here: The poll showing Trump with a 5-point lead is from American Research Group, a pollster that’s had its issues over the years. And other recent polls of New Hampshire still show a Clinton ahead. But the race has clearly tightened in New Hampshire, with Clinton leading by only 2 to 3 percentage points in our forecast – 538

See what else we are monitoring.

Don’t miss our next trade idea. Get on the Bear Traps Report Today, click here
Facebooktwittergoogle_plusredditlinkedintumblrmail

Facebooktwitterrssyoutube