Electoral College Tie? What are Stock Market Volatility and Junk Bonds Telling Us?

“The spread between the 2 month VIX future and the 8 month is converging, just as it did Pre-Brexit.  This is a classic stock market volatility spike early indicator. Get long and stay long volatility over the next two weeks.”

The Bear Traps Report, October 28, 2016

Don’t miss our next trade idea. Get on the Bear Traps Report Today, click here

*FBI’S COMEY SAYS CONCLUSIONS ON CLINTON REVIEW UNCHANGED, 3:25pm ET Sunday

comey-yen

Breaking: NATE SILVER: This election is super-close and Clinton could easily lose: ‘Not a terribly safe position’: Nate Silver predicts Hillary Clinton is ‘one state away’ from losing Electoral College

Likewise per CNN, Hillary Clinton has fallen below the necessary 270 electoral votes, uncertainty has implied equity market volatility near record levels when compared to actual, realized volatility.  Hedge funds and asset managers globally are paying UP for protection.

Pick up our full report, trading ideas here.

Equity Market Volatility – A Tale of Two Markets

One-month implied volatility is near 19.1
30-day realized volatility: 8.6
10-day realized volatility: 5.1*

*is close to the lowest on record, Bloomberg data

This week, the S&P 500’s implied volatility crossed its long term moving average of 20, historically this type of price action occurs prior to large equity market sell offs.

A Flight Back to Treasuries

In a Trump induced flight to quality, U.S. treasuries were handed $2.5B of inflows this week, the highest since the July Brexit “risk-off” run to bonds.

Junk Bonds / Credit is Telling us Something Important

In high yield, CCC paper (the junk of junk bonds) yields 12.7%, that’s 495bps wider than their post-financial crisis tights.  In other words, stocks are within 4.9% of their all time highs, high yield bonds aren’t even on the same planet relative to their best levels.  Speaks to surging default risk in this late part of the credit cycle.

Junk is Telling us Something

hyg-spx

We have a model which measures high yield bond’s performance vs. stocks, a solid “risk-off” leading indicator.  U.S. HY corporate spread index were quoted 533bps OAS on Friday, +48bps since Oct. 27, the sell off in junk bonds has been for more profound than in stocks.  Uncertainty over implementation of Trump rhetoric into policies will fuel a “risk off” bias among global investors.  There will be a short-term flight to quality in corporate credit (bonds), companies will find it more expensive to borrow.  This will lead to re-evaluation of risk tolerance worldwide and capital outflows.

Junk Bond Yields Shooting Higher Relative to Investment Grade

hy-spread-over-ig

One of our classic “risk-off” indicators is making some noise here.  Above you can see Junk bonds have been dramatically under-performing Investment Grade paper over the last two weeks.  We’re seeing much higher yields on junk vs IG bonds.  High-yield bond sales in the U.S. plunged 21% in 2016 when compared with the same period in 2015 as the number of transactions declined.  Companies sold $220B of junk bonds this year through late last week, compared with $274B a year ago at this time.  The number of deals decreased 16%.  Election political risk, lower oil prices and a Fed trying to get off zero are all behind the move.

Where’s the trade?  Join us here.

An Incredible Divergence

This is truly an incredible divergence.  In all our years, we’ve very rarely seen the cost of equity market downside protection rise so much relative to such a small decline in the stock market.  Since highs on October 28th, the S&P 500 is off only 2.6%, while the VIX is nearly 60% higher, from our Bloomberg terminal.

A Rare VIX over VXV Cross, What Does it Mean?

The VIX, or the CBOE Volatility Index shows us an estimate from market participants of where they think future volatility is heading.  The index uses a weighted average of implied volatilities over a wide range of time periods.  Simply put, its the average cost of downside stock market protection.

vix-vxv

Complacency found in the S&P 500 term structure just a few weeks ago has disappeared.  Since the FBI reopened a probe into Hillary Clinton’s emails, volatility has exploded.  The VXV/VIX spread has hit the lowest level since the Brexit referendum.  The CBOE S&P 500 3-Month Volatility Index (VXV) is designed to be a constant measure of 3-month implied volatility of the S&P 500.  One of our 21 Lehman Risk Indicators is found in opportunities around monitoring this spread, it tells us a lot, especially what to do.

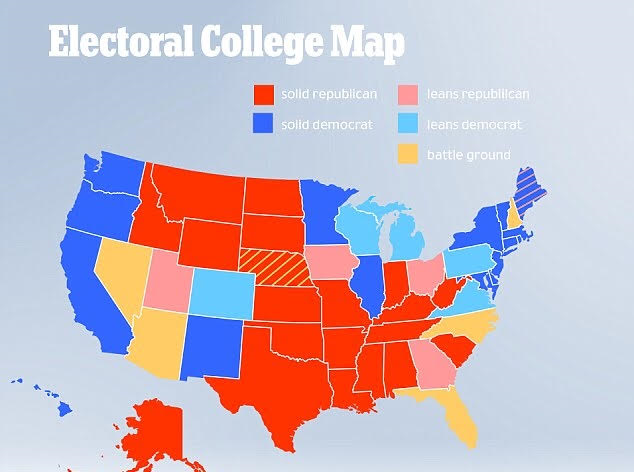
It’s Not A National Vote, Folks: An Electoral College Tie?

This weekend, Trump plans to head to Minnesota in the final days of the campaign. Trump was already scheduled to hunt for votes in Nevada and Colorado later Saturday, states that have been leaning in Clinton’s direction for weeks but may be tightening as Trump sees his chances rise in national polls. He’ll also campaign in Pennsylvania and Michigan, per ACG Analytics.

Minnesota hasn’t cast its electoral votes for a Republican since 1972.  A Republican hasn’t won Michigan or Pennsylvania since 1988.

Beware of Early Voting Media Spin

2012: 125.9m Total Votes Cast

Independents: 44%
Democrats: 31%
Republicans: 25%

Reuters, Bloomberg, ACG Analytics data

Only 125.9m votes were cast in 2012, compared to nearly 131m in 2008.  When watching early vote data come in, we MUST realize how small the GOP segment of the vote was in 2012.  Improvements from 2012 in terms of turnout are key market metrics to watch, we’re keeping an eye on anything that will surprise markets.

What’s the Risk of an Electoral College Tie?

As our partner ACG Analytics has stated throughout this election cycle, there are various moments when one Presidential candidate will surge in the polls relative to another (during his or her party’s convention or in the aftermath of a scandal). But the end game must remain clear: the path to 270 votes in the Electoral College. Many analysts are scouring the little available data which exists on early voting results, hoping to use that data to prognosticate the outcome of the election. With some exception, it is a fool’s errand.

Short of 270

election-2016-3Hillary Clinton (per CNN) has fallen below the needed 270 electoral votes, uncertainty has implied equity market volatility near record levels when compared to actual, realized volatility.  Hedge funds and asset managers globally are paying UP for protection.

Some recent polls show Donald Trump surging against Clinton with just days left to Election Day (Tuesday, November 8th). But the election is not decided by the popular vote, but by votes in the Electoral College, a system which apportions 537 votes among the states—or by the U.S. House of Representatives in the case of a tie or a situation where no candidate receives the minimum requires 270 votes in the Electoral College.

A Trump Surge in the Polls, a Surge in the Cost of Downside Protection

trump-vix

While Hillary Clinton is favored to win the Presidency, a very plausible scenario exists where she does not receive the minimum 270 votes and the election is decided by the Republican House of Representatives. Thomas Jefferson was elected this way. So was John Quincy Adams. The tumult would be a fitting capstone to this tumultuous election cycle. The House of Representatives last elected the President in 1824—192 years ago. But rare events do happen: the Chicago Cubs won the World Series this season after a 108-year shutout.

Beware Early Voting Analysis

Total Votes 2012: 125.9m
Early Voting 2016: 39.3m*
Early Voting 2012: 32.6m

*ACG Analytics projected, 37m through Friday, November 4th

Why beware early voting analysis? Early voting statistics do not divulge for whom someone voted. They divulge how many people have voted and in some states, their registered party affiliation, gender or ethnicity. Party affiliation can be a proxy for whom someone voted. But if one believes that many blue collar Democrats may cross over for Trump and that Trump may lose many Republican women or that more people will vote for a third party candidate than in recent cycles, then early voting statistics are especially opaque this year. Further, even in past cycles, early voting results do not demonstrate a strong correlation with final election outcomes.

An analysis by competitor 538 demonstrates the positive, but weak correlation in a 2-party election (which 2016 is not): pick up our full report here>

Facebooktwittergoogle_plusredditlinkedintumblrmail

Facebooktwitterrssyoutube

Election 2016, U.S. Needs a Productivity Boost

“Entitlement programs and regulation are gradually crowding out capital investment, productivity, and follow on standards of living.”

Alan Greenspan

What’s the Economy Telling us about Election 2016?

This week we learned U.S. productivity rose annualized 3.1% (forecast was 2.1%) after revised 0.2% drop.

The productivity data represents a much needed break from the longest consecutive string of declines since 1979. As the election gets nearer the implications of a fundamental shift in business operating conditions are massive.

Pick up our latest report, trading ideas here.

U.S. Non-Farm Productivity Year over Year

unnamed-31

An ugly picture, an economic expansion well below average.  Over the last five years, annual productivity gains averaged 0.6%, the weakest since 1978-1982.  Disappointing U.S. productivity growth has been embarrassing FOMC policy makers since the recovery began in 2009. 

Fed’s Balance Sheet Shooting Blanks

fed-bal-sheet

Their balance sheet has exploded since 2009 with mixed results. Productivity gains are a key determinant for an economy’s ability to grow. Total factor productivity, a wide measure of the efficiency with which an economy uses its inputs, averaged just 0.29% in the past 12 quarters, according to the San Francisco Fed.

“Business investment has been surprisingly weak”

Fed Chair Janet Yellen, September 2016

Election 2016, Set Her Free, U.S. Economy is Caged

It’s clear to us, the election and regulatory uncertainty, coupled with the entitlement debt crowd-out has U.S. businesses in a straight jacket.  They will NOT invest, created meaningful job growth.  This should all change late next year, give American business owners visibility and we’ll all be surprised at the upside potential.

The U.S. economy is a caged gorilla in the chains or regulatory, tax burden, and entitlement crowd out, set her free.

Don’t miss our next trade idea. Get on the Bear Traps Report Today, click here

Crowdout US Productivity Growth*

2010-16: 0.3%
Bush: 2.2%
Clinton: 2.3%
Reagan: 2.2%

*annual % change in GDP per hrs worked

US Gov Entitlement Transfers % of Total Budget Outlays

2016: 74%
2000 57%
1990 49%
1980 44%
1970 38%
1960 28%
1950 26%
1940 12%

CBO data


Don’t miss our next trade idea. Get on the Bear Traps Report Today, click here


Facebooktwittergoogle_plusredditlinkedintumblrmail

Facebooktwitterrssyoutube

U.S. Jobs Report; What You Need to Know

Join our Larry McDonald on CNBC’s Trading Nation today at 2:30pm.

“Credit risk will VETO the Fed’s desired policy path in 2016, we don’t see a rake hike before the election.”

Bear Traps Report, December 2015

As We Stressed to Clients in January, Credit Risk Driving the Fed Bus, NOT Wages and Jobs

We have a 4.9% unemployment rate in the United States, stable prices with inflation PCE at 1.7%, but Donald Trump is surging in the polls? Millions of people in middle America have been cut out of the current state of the U.S. economy.

In 2007, there were 122 million full time employed Americans, today we have 124 million. That’s an additional 2 million full time jobs over the last eleven years with a U.S. population 26 million HIGHER, per Bloomberg data.

Most people scream demographics to explain this decay in American full time employment.  Wrong.  Research from Goldman Sachs shows the aging population in the USA only accounts for 28% of the plunge in the full time employed over the last decade.

U.S. Full Time Jobs

1990s +14m

2000: 112.1m
1990: 97.9m

BLS data

Economic growth? U.S. GDP is averaging 2.1% GDP growth over the last 8 years, 1.5% this year.  Barack Obama will be the first president on record NOT to have one year with 3% growth, that’s never happened in the history of the USA.

What to Expect from the Fed?

Wall St. has gone from telling us to expect RATE CUTS back in June to a virtually certainty of a December rate hike today. Once again, they’re missing the most important point. Credit Risk has been driving the Fed bus in 2016, NOT jobs.

The October Jobs number came in a bit below consensus at 161k vs 173k median forecast. Our model was looking for 155k.

The unemployment rate did tick back down to 4.9% vs 5% in the previous number. The three month average for job growth is now 176,000. A number that will give the Fed great confidence going into their December meeting. However, it is down from the Sept 3 month average of 206,000.

To get our model, join us here.

What’s Behind the Strength? Government Hiring

image-41
And don’t forget the Chicago Guys! Government hiring was +19k in October. The kicker was government hiring saw a massive upward revision. Hiring was revised in BOTH August and September, NET +35k! (+12k to +47k!). The August government job number went from 23k to 44k and the September number was moved higher by 14k, from -3k to 11k.

Don’t miss our next trade idea. Get on the Bear Traps Report Today, click here

Sectors of strength included; GOVERNMENT hiring, servicing related industries, health care and social assistance +39.1k and education +52k, these have been bright spots in recent reports as well.

The Question is Does it Matter?

This indicator is pointing toward a Trump win. With this contested election just four days away, the market is worried about bigger issues. Election and Market risk is driving the Fed bus. A rate hike in December is off the table with a Trump win next week.

peso-1-m
Market participants are hedging their Trump risk. The 1 month volatility of Dollar/Mexican Peso suggests this election is very close and markets are nervous. Until Tuesday passes, this is a key metric we are watching as barometer of Trump risk.

Clinton Firewall Breach

There’s been a potential breach of Hillary Clinton’s electoral firewall. And it’s come in New Hampshire, a state that we said a couple of weeks ago could be a good indicator of a Donald Trump comeback because of its large number of swing voters. Three new polls of New Hampshire released today showed a tied race, Trump ahead by 1 percentage point and Trump up by 5. There are some qualifications here: The poll showing Trump with a 5-point lead is from American Research Group, a pollster that’s had its issues over the years. And other recent polls of New Hampshire still show a Clinton ahead. But the race has clearly tightened in New Hampshire, with Clinton leading by only 2 to 3 percentage points in our forecast – 538

See what else we are monitoring.

Don’t miss our next trade idea. Get on the Bear Traps Report Today, click here
Facebooktwittergoogle_plusredditlinkedintumblrmail

Facebooktwitterrssyoutube

Bank of England Stays Put; 3 Things You Need To Know

The Bank of England decided to stay the course today  by leaving their benchmark interest rate unchanged  and continuing with their rate of easing.

Don’t miss our next trade idea. Get on the Bear Traps Report Today, click here

As we stressed in a macro note out to clients, the Bank of England does not have the fire power to deal with the Pound’s move lower, based off of Brexit concerns. This is why we issued our long term negative view of the Pound against the U.S. Dollar.  Where do we think the Pound is going?

Join us here

Don’t miss our next trade idea. Get on the Bear Traps Report Today, click here


Pound Side Effects

uk-current

Many central banks around the world have been trying to muster up ways to increase inflation. The answer is simple,  run a large current account deficit (imports being more than exports) so when your currency weakens, costs in the country surge. This is what the UK is facing. 

In their August the meeting, the Bank of England had a large bias to do further easing by cutting the benchmark interest rate. With inflation on the rise and growth factors improved, the Bank of England has switched to a “neutral” perspective on interest rates.

Inflation is on the Rise

uk-5s-2-0

It did not take long for market estimates to adjust to the weakening pound. Inflation expectations have been surging and do not look to be leveling off. The market knows the Bank of England has limited options with regard to strengthening the currency, so a hard Brexit will further import cost increases as the Pound will continue its descent. 

Don’t miss our next trade idea. Get on the Bear Traps Report Today, click here
Facebooktwittergoogle_plusredditlinkedintumblrmail

Facebooktwitterrssyoutube

Before the Fed Meeting, 3 Things You Need to Know

As the Fed concludes its two day meeting, here are few things we are monitoring.

Don’t miss our next trade idea. Get on the Bear Traps Report Today, click here


Odds off a rate hike in December have surged to around 70%.  Much of the street is now even expecting that the Fed will directly forecast a December move in the November statement.  For example, Goldman is looking for “‘next meeting” type guidance, we do NOT agree.  The Fed will not want to box themselves in with so much prevailing risk yet to be resolved.

Back in October of 2015, the FOMC altered the statement to get the street ready for the December hike, not this time.  We’re too close to election 2016.  In preparing the market, the Fed has done their work through Fedspeak and data.  The market has already priced a high chance (near 70%) of December rate hike.  When we bought our gold miners, the rate hike odds were 55%.

With clients we are outlining these risk, trade ideas and how monetary policy will likely react.

A LOT is being Priced in

image-27

With inflation finally on the rise, continued Job gains above 150k a month and a pickup in the manufacturing sector, the market seems to be giving the Fed the all clear. We still believe that too much is being priced into the December meeting. 
Much of the improved economic data from surveys such as ISM and Markit PMI, has come from the increased price of oil. A lot has changed in the early days of November as oil has puked lower!

unnamed-4

The recent drop in Oil will surely weigh on the next release of the ISM survey as the production side has begun to assume oil would stay above $50 in medium term. This re-pricing of oil will lower the recent rise in costs and will slowdown excitement for energy and energy related producers. A reevaluation of this assumption will have negative consequences on producer activity and thus the economy.


Don’t miss our next trade idea. Get on the Bear Traps Report Today, click here


Facebooktwittergoogle_plusredditlinkedintumblrmail

Facebooktwitterrssyoutube

What’s Behind the Surge in Stock Market Volatility? 3 Things You Need to Know

Join our Larry McDonald on CNBC’s Trading Nation this Wednesday at 2:30pm ET

Pick Up our Election 2016 Trading and Investing Themes Here:

Don’t miss our next trade idea. Get on the Bear Traps Report Today, click here


The VIX is up 56% since our election call last week, once again the crowd was way off sides.
“Despite relentless attacks, Trump’s polling data has actually improved in the last two weeks.  According to the Media Research Center, over 90% of Trump media coverage over the last 12 weeks has been “Hostile”. We want to be long volatility (VIX) heading into the election.  If Trump’s chances surge from 25% to 65% back to zero the day after the 2016 Presidential election, there’s a substantial amount of money to be made long volatility, short the Mexican Peso (Long USDMXN) and long Healthcare sectors.”
From the Bear Traps Report, October 26, 2016


Don’t miss our next trade idea. Get on the Bear Traps Report Today, click here

Donald Trump and Market Volatility

Trump’s Surge in the Polls, Comes with Stock Market Volatility

We’d like to personally thank the thousands of journalists who were instrumental in helping markets mis-price risk.

trump-vix

RCP = Real Clear Politics average of over 15 national polls

VIX = The Chicago Board Options Exchange Volatility Index reflects a stock market estimate of future volatility

As you can see above, stock market volatility is directly tied to Donald Trump’s election fortunes.  As “The Donald” has surged in the polls, so has volatility in the markets.  Over 1000 journalists globally have conditioned investors that this election is over, equity markets are NOT prepared for a Trump Presidency.

Here’s what market pros are watching.  Activity in the VIX futures market and the Mexican Peso speak to a market volatility spike in the near term for U.S. equities. In the below chart, the spread between the 2 month VIX future and the 8 month is converging, just as it did Pre-Brexit. This is a classic vol spike early indicator. Get long and stay long volatility over the next two weeks.”

Quote from Bear Traps Report, October 31, 2016

Flattening VIX Curve, A Market Crash Omen

vix-futures-new-3In this chart we see how much flatter (green line above) the VIX curve is today than it was last week (blue line) and even in August (orange line).   Elephants leave footprints, capital is piling in on purchasing near term insurance on the stock market, the green line says it all. 

This summer, the market was complacent and ignored coming risks.  Longer dated VIX contracts traded much higher than those in the short term. This gives you a very steep VIX futures curve as we saw last week. The market was not paying up for near term volatility as it was heavily discounting risks such as the U.S. election. The curve began to flatten yesterday, which gave us a proprietary risk signal that further volatility and weaker equities would be coming next.  Today we got it, as the short term VIX contract heavily outperformed the longer dated contract.  This was a market sell signal we shared with clients this morning.  Institutional investors were buying near term protection in the face of uncertainties such as Trump, Italian credit risk and a lower oil price, events we expect to continue.

Pick Up our Election 2016 Trading and Investing Themes Here:

Don’t miss our next trade idea. Get on the Bear Traps Report Today, click here


As we advised clients yesterday, a sharp flattening of this curve leads to risk reduction across asset classes. Today, we saw that play out with equities and credits selling off.

Elephants Leave Footprints, Look for the Clues

ux2-ux8-speed

Here, we see the convergence in the 2 month VIX future and the 8 month VIX future. Money is piling in on the 2 month, meaning people are paying up for short term insurance on the market. The 2 month VIX future is getting bid up, becoming more expensive. This shows the markets more near term fears.

Pick Up our Election 2016 Trading and Investing Themes Here:

Don’t miss our next trade idea. Get on the Bear Traps Report Today, click here

Here’s our appearance on CNBC today

Facebooktwittergoogle_plusredditlinkedintumblrmail

Facebooktwitterrssyoutube