
Join our Larry McDonald on CNBC’s Trading Nation, Wednesday at 3:05pm ET
Our Thought Leadership Series on Real Vision is Coming Soon – See our Latest – Debt Jubilee here.
 Our Larry McDonald with hall of fame historian Niall Ferguson in Manhattan Friday. The Debt Jubilee, see our latest sit down on Real Vision here .
Pick up our latest report here:
Don’t miss our next trade idea. Get on the Bear Traps Report Today, click hereWatch Financial Conditions NOT Economic Data
 We often tell clients, “credit leads equities.” Even more important, tightening financial conditions (FCIs) drive Federal Reserve policy movements, NOT lagging economic data. Nearly every economist in the U.S. was calling for 2-3 rate hikes back in October / November – even as financial conditions were tightening at the fastest pace since 2015. By focusing on FCIs, in late Q3 2018, we were able to position clients in a basket of “Fed Pause” trades (emerging markets, energy, gold) – this thesis has played out beautifully.
Inflation, down but NOT Dead
It’s interesting to note just how much financial conditions have eased since the Fed’s hall of fame cave. This speaks to creeping reflation risk, a rate hike probability revival. Gold has been singing this tune over the last week.
Hints of Reflation
 The very latest reading of the core PCE index, rose 0.19%, its largest monthly gain since May. Prices for services, more sensitive than goods to domestic labor supply / wages, surged 0.29% – the largest jump in nearly 15 months. It’s also interesting to note how much bonds have rallied with sharply lower yields in U.S. Treasuries, while core PCE inflation is still up meaningfully over the last 18 months and NOT giving up any ground (see the white circle above).
Bonds are Taking a Beating in recent Days
 Just when the Street gave up on reflation and the rate cut camp started to overflow – bonds put in the most significant sell-off since Q2 2018 in recent days. It’s looking more and more like China hit the panic button heading into the trade negotiations. They were dealing from a position of weakness with an economy reeling from the sharpest global slowdown in decades. The mountain of fiscal and monetary policy actions they’ve taken is nothing short of remarkable. RRR cuts, tax cuts, infrastructure spending splurge. Looks like an $800B boost to the German economy 🙂 – maybe global synchronized growth will appear on stage after all?
The China Panic Button
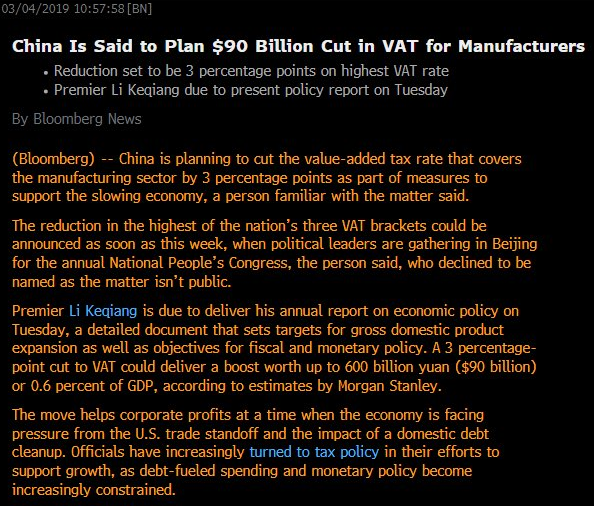 Economic boost: This will help Xi’s team sitting across the table from Uncle Bob (U.S. trade hawk) Lighthizer.
Financial Conditions vs. Credit Availability Surveys
We must track true credit conditions, credit availability – follow the leading indicators.
C&I Senior Loan Officer Survey
 The CDX IG is the most followed measure of corporate credit conditions in the U.S., we’re looking at the credit spreads on large investment grade companies above. As you can see, credit conditions tightened dramatically, and then the senior loan officer survey caught up with what the CDX IG was telling us weeks earlier. The Fed pays close attention to the loan survey data above, unfortunately, it takes forever to compile the STALE data. The survey above is the most recently available, as of January 31, 2019, but the actual engagement with loans officers was compiled in Q4. The white line above is telling you current credit conditions are easing, and easing fast relative to the now “out of date” C&I loan survey data.
Working with our Associate Ed Casey
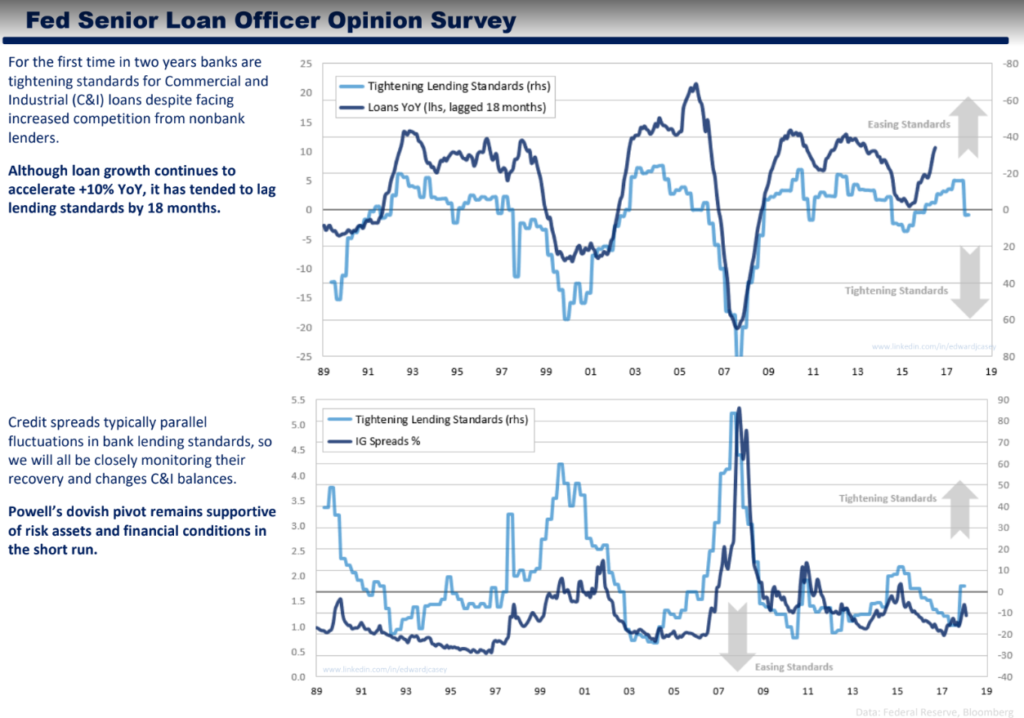
Our associate Ed Casey points out, the first time in two years, banks were tightening standards for Commercial and Industrial (C&I) loans in Q4 despite facing increased competition from nonbank lenders. Although loan growth continues to accelerate +10% YoY, it has tended to lag lending standards by 18 months. Corporate credit spreads typically lead bank lending standards, so we will all be closely monitoring their recovery and changes C&I balances. Fed chair Powell’s cave-athon – or dovish pivot – remains supportive of risk assets and financial conditions in the short run. Pick up our latest report here.
In the hole, December 2018, see our high conviction “get long equities” call here.
Charge-Offs
C&I delinquency and charge-off rates remain close to historical lows, indicating few signs of asset quality stress which is support for risk assets.
Levered Up Economy
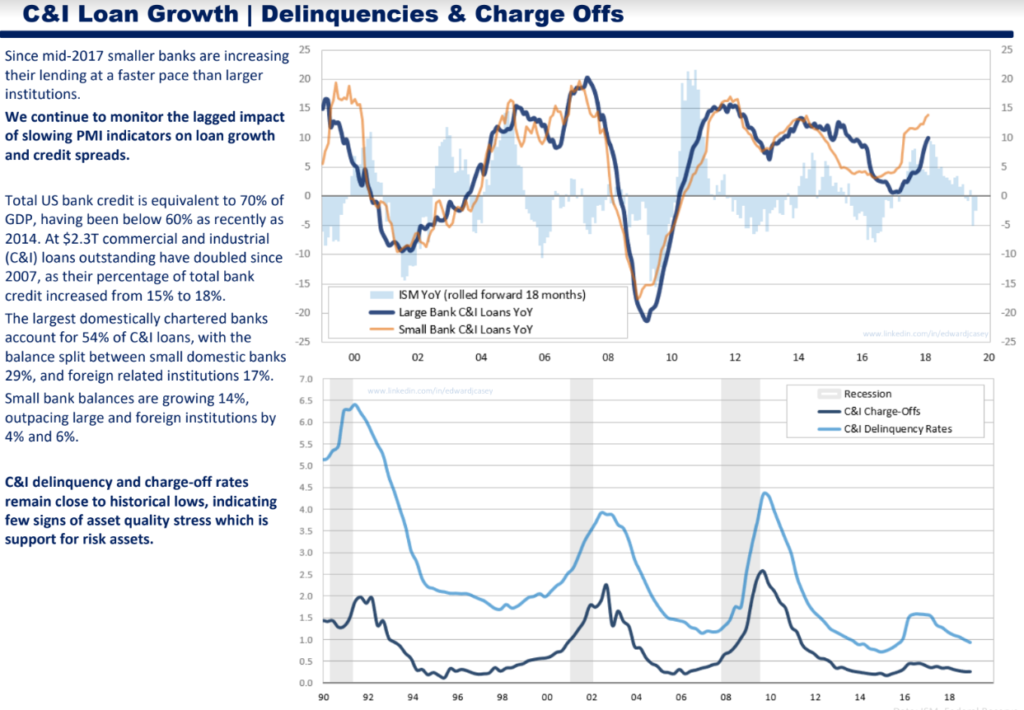
Our Ed Casey notes, total US bank credit is equivalent to 70% of GDP, but below 60% as recently as 2014. At $2.3T commercial and industrial (C&I) loans outstanding have doubled since 2007, as their percentage of total bank credit, increased from 15% to 18%. Since mid-2017 smaller banks are increasing their lending at a faster pace than larger institutions.
We continue to monitor the lagged impact of slowing PMI indicators on loan growth and credit spreads. Pick up our latest report here.

