
“With a cross-asset view (emerging market currencies, eurodollar/Fed funds, gold, and silver); bets on a “one and done” Fed have dramatically outperformed U.S. equities in Q4 and are all pointing to early signs of a softer Fed policy path. Looking down the road ahead, the U.S. equity market will CRASH in 1987 style if the Fed plays tough guy (3/4 more rate hikes?!), it’s that simple. Similar to the March 2016 landscape, the market is about to embarrass the Fed yet again. As we have stressed over the last month, they will capitulate in our view. Stay long emerging markets EEM, gold GLD and the gold miners GDX.”
Bear Traps Report, November 15, 2018
Join our Larry McDonald on Real Vision here, a video blog with value.
Pick up our latest report here:
Don’t miss our next trade idea. Get on the Bear Traps Report Today, click hereBreaking: *AUSTRALIA’S 10-YEAR BOND YIELD DROPS TO ALL-TIME LOW – Bloomberg at 5:39ET, March 24, 2019
Using Equities to Confirm Signals coming from Fixed Income Markets
At the Bear Traps Report, we take a cross-asset view from 20,000 feet looking for important signals which can validate an investment thesis. Today, fixed income and equity markets are telling us something, and it’s time to listen.
March 2019: Ex-Fed Chair Yellen, Global Central Banks Do Not Have Adequate Crisis Tools
June 2017: Fed’s Yellen expects no new financial crisis in ‘our lifetimes’
Recent yield curve inversion has central bankers a bit uncomfortable.
Equities, Consumer Discretionary are Crushing Staples
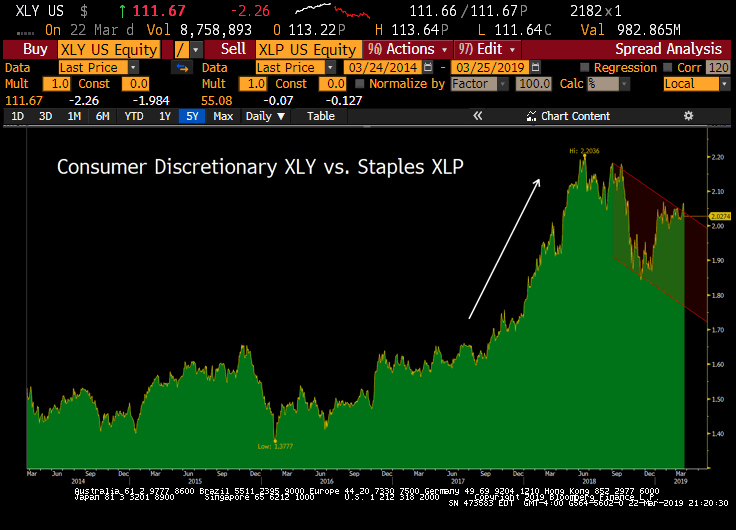 In recent years, U.S. equities in the economically sensitive consumer discretionary XLY sector have substantially outperformed consumer staples XLP (82.6% vs. 47.9% over the last five years total return). Since June 2018, the world has changed – staples XLP have had their day in the sun (red channel above). During Friday’s 500 point swoon in the Dow Jones Industrial Average, the XLY was 2% lower – while defensive equities in the XLP were unchanged – a sign of things to come. What’s the connection here between what bonds and equities are telling us?
From the Recent Highs
Regional Banks $BKX -10.6%
Financials $XLF -6.9%
Russell $IWM -4.4%
Dow Transports -3.8%
Semiconductors $SMH -3.5%
Energy $XLE -2.9%
Dow -2.8% FANGs -2.6%
Cons Disc $XLY -2.0%
Oil -1.8%
Utilities $XLU +0.40%
Staples $XLP +1.1%
It’s far too early to draw major conclusions, but one thing is clear – economically sensitive sectors (banks, small caps) are leading the way lower for now.
Floating Rate Loans Take a Beating
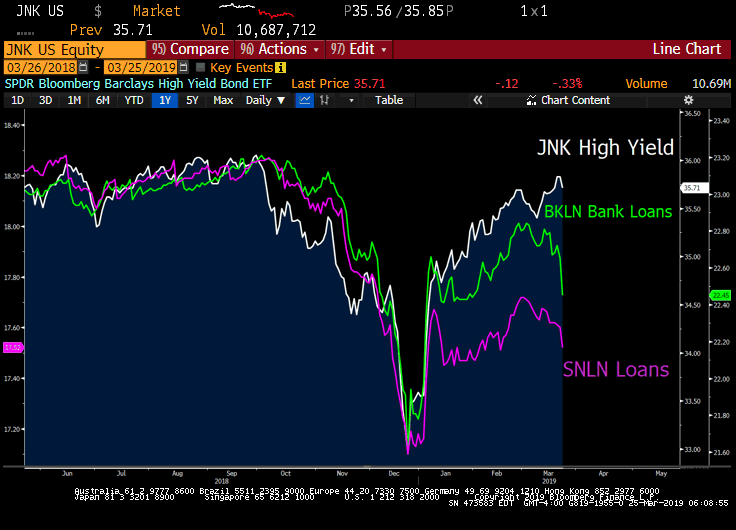 When Fixed Income markets start to price in a cap on near term / intermediate term bond yields, floating rate securities begin to dramatically under-perform (bank loans BKLN).
Economic Risk Indicators
In October, Wall St.’s economists were looking for 3-4 more rate hikes. Here we are in March and they’ve thrown in the towel. Clearly, there are so many cross-currents to watch. Most are obsessed with the U.S. Treasury curve. Late this week she inverted for the first time since the start of the financial crisis, it’s the talk of the town. Economists call this the first reliable market signal of an approaching recession and a rate-cutting cycle coming at us.
Financials Leading Stocks Lower
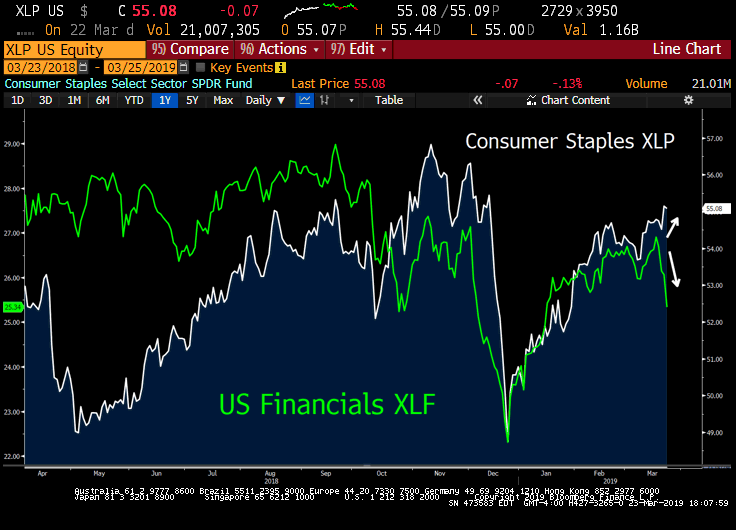 Since October, the 2-10s US Treasury curve has flattened from 34 to 11bps. Since March 18, the XLF Financials ETF has plunged nearly 7%, the KBW Nasdaq Bank Index of large lenders posting its biggest one-week slide since 2016, off 10.6% since Tuesday – all with the staples XLP up 1%. Sure, we all know banks’ earnings power struggles with a flat curve and the follow on pressure on net interest margins. But, is this downdraft in the financials simply a product of a flattening yield curve? Or is something more ominous afoot?
US Corporate Bond Binge
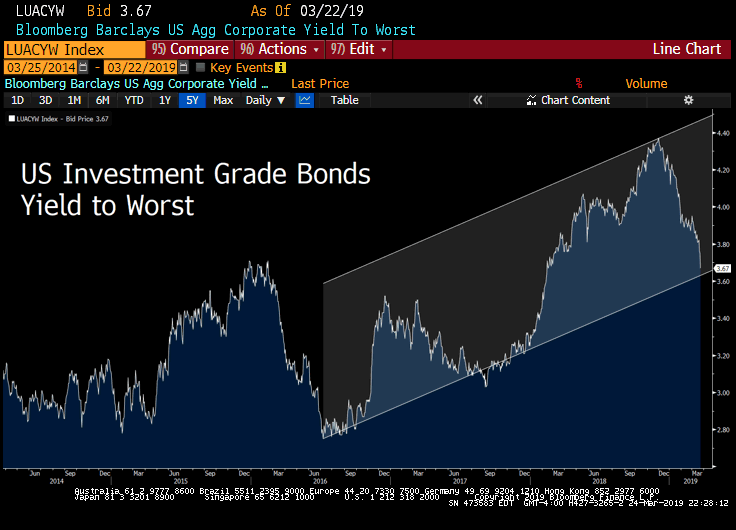 Yields on U.S. investment-grade bonds have plunged to the lowest in more than a year.
3-Month vs. 10-Year Treasuries
After 9 rate hikes, the Fed has pushed its target rate or “upper bound” to 2.50%, this is holding up the front end of the yield curve. At the same time, global economic pressures have investors buying long-dated bonds, putting downward pressure on yields.
German Bond Yield Back to 2016 Levels
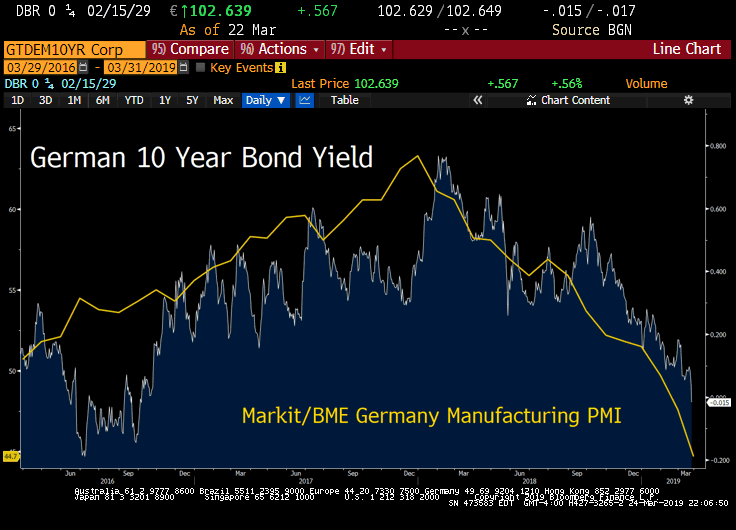 German 10-year bonds were up at 0.57% in October, they touched -0.01% this week – their lowest yield since 2016. The last time bond yields in Europe were this low the ECB was buying $60 to $80B a month of asset purchases vs. just $5 to $10B today.
Where’s the Trade?
Late this week, the spread between the three-month and 10-year U.S. Treasury yields evaporated, a rush of panic buying pushed 10’s yield to a near 15-month low of 2.40% – the 3-moth TBill yield is 2.40% as well. In Treasuries, a three-month investment or ten years, the yield is the same. Everyone knows inversion is considered a reliable omen of a recession in the U.S., within roughly the next 12-18 months – but where’s the trade?
An Economist Worth Listening To
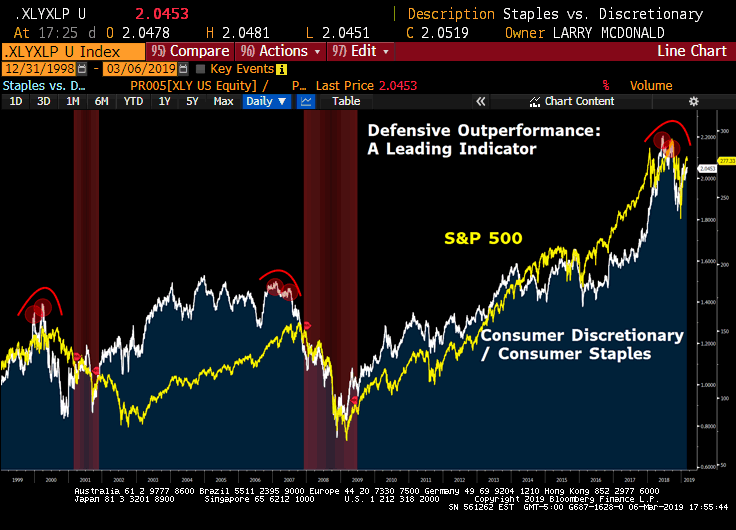 We have an economist (above – white line) that’s actually worth listening to. As you can see above – going back 30 years – well before U.S. recessions, consumer staples dramatically outperform consumer discretionary stocks. When we take a close look at a recession-proof sector like the staples XLP ETF vs. a sector with a high degree of economic sensitivity, consumer discretionary XLY – we come up with eye-opening data. Notably, this ratio has historically rolled over before yield curve inversions as well. Historically, yield curve inversion only confirms what Stan’s economist is already telling us. For our full report, join us here.
Stan Druckenmiller’s Economist
We must introduce you to Druckenmiller’s Economist. Stan will tell you, looking at U.S. Treasury yield curve inversion – in isolation – relative to recession risk is a fool’s errand.
On our Real Vision platform, recently billionaire and legendary investor Stan Druckenmiller talked about clues he takes from the stock market and various economic indicators he uses to make an informed decision about where we are headed. Stan often refers to his “economist” in measuring the performance of different economically sensitive sectors. We agree, but let’s look at fixed income and equity signals together. How do the Staples XLP perform vs. the S&P 500 SPY once the Treasury curve inverts?
Fixed Income Signals in Equity Markets – Consumer Staples vs. the S&P 500
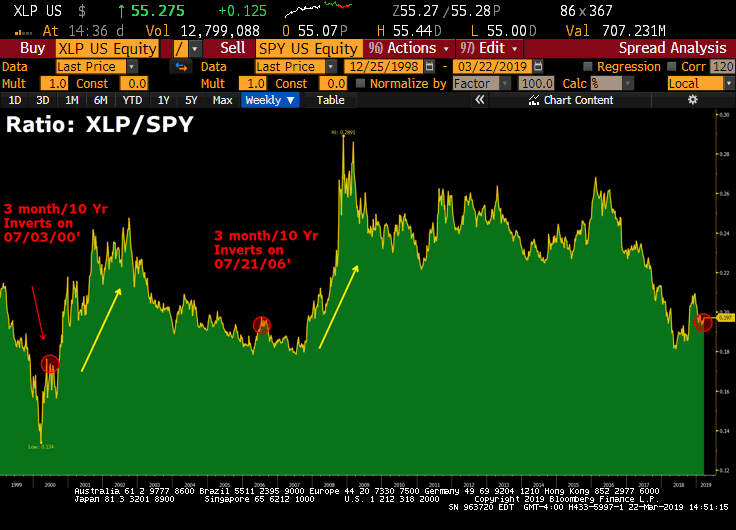 Since 1990, the 3 Month / 10 Year yield Curve has inverted twice. During 2000 to 2002 and from 2006 to 2008. Staples outperformance was substantial in these periods.
**Notably, staples outperformance does not start immediately. For example, in the Financial Crisis, it takes over 12 months for the XLP to outperform the SPY after inversion. Though it took over a year, the relative performance accelerated quickly in 2008.
Stapes vs. S&P in a Post-Inversion Regime
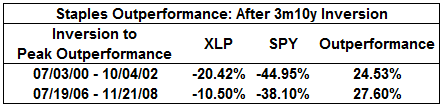 Above, is the peak to which staples outperforms the S&P 500 post-inversion. If it was a fight, they’d stop it. In a late cycle, post “yield curve inversion” regime, investors want to be overweight consumer staples – and underweight the S&P 500. Bottom line, the key lessons from previous cycles must be listened to:
1) After “sustained” U.S. Treasury yield curve inversion, equity markets are unlikely to experience a meaningful recovery (price appreciation) from that point forward.
2) Yield curve inversion signals are near meaningless in isolation. We need to see early confirmation from Stan’s economist; defensive sectors’ (staples) outperformance relative to cyclicals (consumer discretionary).
** Beware of fake-outs in yield curve inversion. The 3-Month / 10-Year yield curve inverted in 1998 but only for a FEW DAYS. However, the data seen above begins when the curve consistently inverts in July 2000. In 1998, the S&P 500 rallied viciously after inverted yield curve signal – some call this the Greenspan Put – Wall St. was forced to come together with the Fed to ‘save’ Long Term Capital. This false inversion signal would have caused one to miss out on the next leg of the equity rally.
Pick up our latest report here:
Don’t miss our next trade idea. Get on the Bear Traps Report Today, click here

