
“Our indicators tell us, we’re very close to a Lehman-like drawdown,” argues Larry McDonald, a former strategist at Société Générale who now runs The Bear Traps report.
Financial Times, February 20, 2020
*Our institutional client flatform includes; financial advisors, family offices, RIAs, CTAs, hedge funds, mutual funds, and pension funds.
Email tatiana@thebeartrapsreport.com to get on our live Bloomberg chat over the terminal, institutional investors only please, it’s a real value add.
Don’t miss our next trade idea. Get on the Bear Traps Report Today, click hereBreaking *ELON MUSK PASSES WARREN BUFFETT ON BILLIONAIRES RANKING
Breaking: Monday, Tesla $TSLA: close to an -18% interday-reversal on a $300B equity market cap company, today’s high to after-hours low, significant price action, TELLING. BEARISH.
Oh, The 90s
Besides Michael Jordan’s Rings, The Clinton’s and White Ford Bronco’s – what we remember most about the 1990s was the colossal spread which formed between Wall St’s 12-month price targets on stocks and the actual insanity found in the last trading price. Across the Street, in many cases, the analysts could NOT keep up with the mad mob bidding shares higher. Very large spreads were formed. What does this tell us about the summer of 2020? Let’s explore.
You Can Drive a White Ford Bronco through this Spread
 Both at Bullish and Bearish extremes, when analysts are this wrong, bad things happen. Tesla’s shares closed at $1544 on Friday, July 10, 2020, but the Street’s twelve months price target is down at $780? Close to 40 analysts cover TSLA stock; 16 Sells, 11 Buys, and 9 Holds. The highest price target is $1500, the lowest is $70, Barclays and Cowen are down at $300, JP Morgan at $295. In June, Goldman downgrades the stock to Neutral and kept their $1300 target.
What on Earth is Going On?
Call it the great Front-Run. To be considered for S&P 500 inclusion, the company needs more than 3 consecutive quarters of profitability, thus TSLA has NEVER been in the index. With a total enterprise value now close to $300B, and Tesla reports on July 22., speculators are betting the people at S&P are eager to add TSLA equity to the index. By buying up Tesla TSLA now, front-runners are forcing the S&P Indexes to give the stock a higher and higher weighting (the S&P 500 is a market-weighted index, the higher the companies value, the higher the weighting). Thus, ETFs / Indexes will be forced to pay up, buying even more shares. Then the hot money exits, leaving indexes holding the bag. If inclusion doesn’t happen, look out below.
Buying pressure from S&P Inclusion
There is approximately $3.9T of pure index capital following the S&P500. These are mostly index funds, including ETFs and mutual funds that mimic the S&P. TSLA market cap is $278B but Musk owns 18.4% of the stock. The free-float market cap is therefore $220B. Base on the S&P market value of $27.8T that means TSLA should get a 0.8% weight in the S&P. This implying $30B of buying power from index buyers. Note that every $100 on TSLA stock price means $3B additional buying power from index trackers and vice versa.
All Important July 22, 2020
Tesla reports earnings on July 22nd after the close, if they’re able to able to churn out even the smallest profit, there’s a real chance it could happen, one large new addition to the S&P 500. On Friday, well over $1B was traded in TSLA’s options expiring July 17th, with millions betting on the $2500 strike (stock closed at $1544 Friday). Insanity.
*To be included in the index, a company must meet eight primary criteria having to do with market capitalization, liquidity, financial viability, and other factors. Share-based compensation affects GAAP earnings. S&P inclusion requires a minimum of 4 quarters of GAAP income. Musk’s award was $770m, they previously accrued most of it and ‘delayed’ performance reviews for all the other employees. Some say this part is covered. With Kunal Shah, we believe this to be true.
“As an index committee member (local) in the past. Inclusion is not on autopilot. They may still refuse if they think accounting is dodgy. Second, if it goes in it should be on some watch list for a while, so inclusion is more likely in Dec. That’s a long time. But in a big picture yes – if he manages to pull it off, he (Musk) would take his billions in bonuses and do a huge offering, which might allow for the shenanigans with reporting to be reversed.” – Grigoriy Isaev
NY Fed on Inclusion
Per the NY Fed, the pre-inclusion changes in firm characteristics are substantial. “For our sample, on average, the increase in market capitalization in the two years preceding inclusion, adjusted for changes in the aggregate market level, is 56%. ” The increase in market value reflects the pre-inclusion price momentum, and it coincides with the strong earnings performance of the event firms. The total increase of EPS in the fiscal year before inclusion and the year of inclusion is about 57%, per the NY Fed. In other words, there’s a heavy incentive for companies to juice earnings ahead of inclusion.
On the Changes to the Index Inclusion Effect with Increasing Passive Investment Management
Per the University of Pennsylvania, empirical analysis of the S&P 500 index inclusion effect for additions to the index between 1981 and 2015 is revealing. The analysis finds that between 1990 and 2015 the average excess return for additions from the announcement to effective day was 5.64%. This is a low number because of all the gamesmanship pre-inclusion. Over the years, more and more investors have been drawn into this front-running game. The large the colossal passive index flows (now in the trillions), the bigger this contest will become. UPenn’s research was executed before the recent explosion of capital coming into passive index funds.
The bottom line, more passively linked funds create a larger shift in the demand curves for the stocks around inclusion, but some results do not yield such conclusions. Keep in mind, UPenn was NOT looking at a MONSTER $300B new addition to the S&P 500, this is a rare event indeed (by far the largest ever). S&P 500 inclusion is a career decision indeed, we wouldn’t want to make it. The life cycle of Tesla as a public company has been highly unusual, to say the least. For years, there have been questions about the company’s accounting and departing CFOs. Busier than musical chairs, Tesla has had more chief financial officers than Lehman Brothers went through during the company’s last years before its “Colossal Failure of Common Sense.” For years, the company’s junk bonds provided a yield of 7-9% in a land of near 0% cost of capital (thanks to central banks). At the same time, the company commanded a $50B to $100B equity market cap. For a number of reasons, the company has NEVER been included in the S&P 500, Tesla is one VERY late bloomer indeed. One can make the argument that true capitalism died years ago. Without a mountain of assistance from the federal government (solar / energy subsidies) and wide-open capital markets forged on the back of central banks, Tesla would not be with us in its current form.
A Top 15 Position Weighting in the S&P 500?
Keep in mind, Procter & Gamble is the 10th largest position holding in the SPY SPDR S&P 500 ETF Trust with an equity market capitalization of $306B. So we can safely assume Tesla with a current market cap close to $300B, TSLA would crack the top 15 upon entry (if the shares hold on to current, extreme valuation level). This is one colossal addition to the index, a significant event.
Don’t miss our next trade idea. Get on the Bear Traps Report Today, click hereThe Bulls Case
The most optimistic bulls are looking for $21 to $23 earnings per share in 2021, so TSLA is trading nearly 71x those rosy assumptions, and made $0.20 last year per Bloomberg. Tesla is trading near 11x sales with a total enterprise value of just under $300B. Last year’s sales came in at $24B, with $27B expected this year, and close to $40B is the Street’s outlook for 2021. The bulls will tell you TSLA has just a 0.5% share of global seasonally adjusted annual running rate (SAAR), or 16-18% share of electric vehicle sales worldwide. The bottom line, the bulls assume large market share additions in the 2021-2030 period.
*Tesla Model 3 = 1/8 Of World’s EV Sales In 2019. Tesla accounts for 1 out of every 6¼ global plug-in vehicle sales. The Tesla Model 3 alone accounts for 1 out of every 8 global plug-in vehicle sales, 13% of the global market. – Clean Tech.
“I have spoken to battery engineers at NON-frauds; i.e., not Tesla. The realistic hope is that solid-state batteries will bring a 30% to 40% improvement in energy density with considerably more safety. Toyota & the Germans will have them in production by 2025.”
Mark Speigel, Stanphyl Capital
Lithium Mining, Still in a Bear Channel, Why?
 Optimists say, with the help of a Biden White House, by 2030 close to 100% of SAAR will be in the electric vehicle space. With a battery mileage range of 1000-1200, the bulls say the ICE (Internal Combustion Engine) will be nearly obsolete. But, if this is the case looking forward, why aren’t large lithium miners a lot higher? During 2017’s electric vehicle excitement phase, when investors were piling into anything and everything EV, Albemarle was near $150 a share vs. the $78 today. As one of the largest lithium producers on earth, Albemarle is uniquely positioned and a far more attractive value relative to Tesla. In 2015, ALB finished its $6.4B takeover of Rockwood Holdings (one of the Big 4 lithium producers globally), the company is an anchor tenant in the lithium space. The Street expects Albemarle to capture a LARGE share of global lithium-demand growth over the next several years. An oversupplied market risk in 2020 has been the question mark. Some analysts point to the negative impact of the coronavirus on electric-vehicle demand. The company slowed the pace of its lithium expansion to help balance the market while it continues to consolidate its position in catalysts.
*Lithium is the key component of batteries in electrically-powered vehicles and other battery-powered applications. Rockwood’s lithium-based compounds are used in a variety of high growth applications, including base chemicals for numerous industries, drug intermediates, elastomers for car tires and rubber soles, lithium batteries, thermoplastic materials, and high-performance greases. Rockwood has lithium production facilities in the United States, Chile, Germany and Taiwan.
 On July 21, 2020, Silver surged 6% before 9am. Keep in mind silver’s all-time high is over $50, while today gold is very close to its 2011 perch. Silver has some large scale catching up to do. We went to a full, “high conviction” silver position for clients in late March 2020.
 We have recently lightened gold but maintained a full 3/3 position in silver SLV and 2/3 XME materials and metals. We MUST NEVER forget how many investors globally are crowded into U.S. equities. When a stock’s performance in gold starts to look unattractive, U.S. equities will lose some portion of their global investor-base. So many things can be said about the chart below but we think what it really does is cancel out the Fed effect. Meaning, the Fed has caused the inflation of both stocks and gold – higher asset prices for sure.
 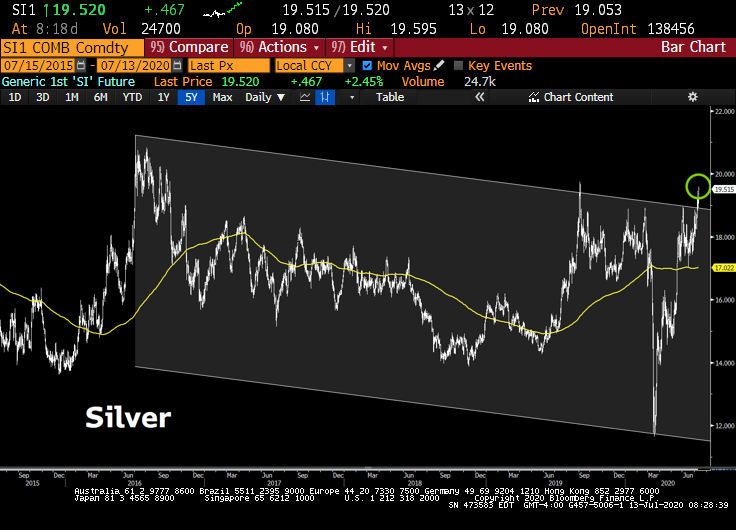 Lots of new paper wealth on the planet is looking for a hard asset hedge. During the week ending July 10th, another $1B flowed into gold and silver ETFs. Silver is a very small pond relative to the near $40T in US paper assets.
  We agree it looks much more natural. We think the price of the S&P in dollars is the ultimate Fed head-fake. The entire 2018 move has been canceled. It is really a revelatory chart. It’s super important! U.S. stocks in gold terms are trading at late 2017 level if my eye doth not misread, one ugly equity rally indeed. Poor foundation, in two words.
 With over $35T in paper-promises; U.S. Treasuries $15T, U.S. Corporate Bonds $11T, Big Tech Stocks $7T, and U.S. Municipal Bonds $4T – all that new wealth is crowded in financial assets – looking for a real, hard asset (hedge) alternative. At some point, when the promissory note pool becomes too large, more and more capital starts to look for a hard asset (copper) hedge, WE ARE THERE.
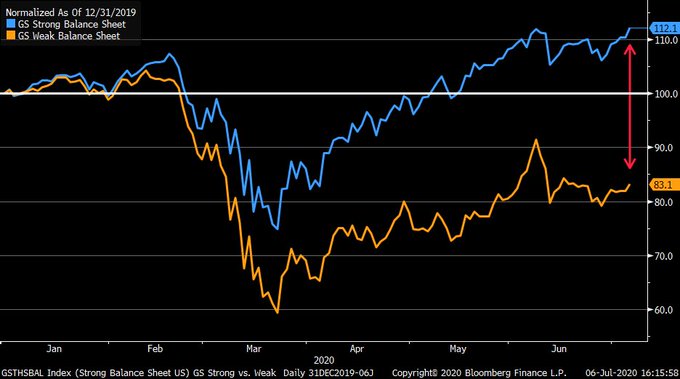 As you can see above, credit risk is driving equity prices. Well funded sectors (
 Since January, we have experienced over $4 trillion of deficit spending and $3T of balance sheet expansion from the Federal Reserve. Will the U.S. continue to borrow more, to print more, to stimulate more? A disastrous 11% unemployment number was greeted as a positive surprise.
 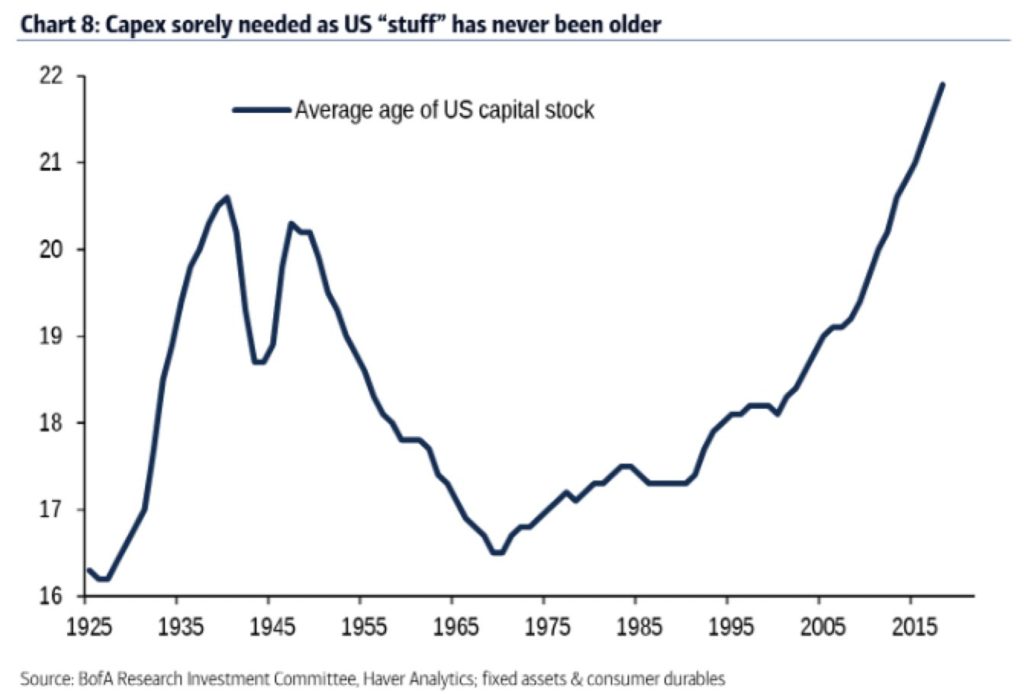 The latest bill passed by the Democrat-controlled House of Representatives concocts a $3 trillion infrastructure bill spending that represents a jump towards a Green New Deal, and unabashedly so. The Republican-controlled Senate knows not what to do: on the one hand, it doesn’t want an infrastructure bill it deems not truly an infrastructure bill, but on the other hand, rejecting what is touted as jobs creating legislation makes for bad optics politically. One would hope that some sort of infrastructure bill slithers out of the Senate before August recess. Assuming a compromise bill is signed in September, then what? Why, more trillions of dollars to state and local governments whose coffers have been emptied by lockdowns. Of course.
 Big credit expansion from the Federal Reserve and a colossal fiscal boost has significantly reduced credit card delinquencies and increased car purchases. Those two phenomena will reverse once the $600 a week safety net vanishes after July 31st. We expect Congress to extend the PPP program for small businesses, but in a more focused format that supports only the hardest-hit businesses. Extending the full $600 per week in Pandemic Unemployment Compensation (PUC) is highly controversial and will NOT last past July.
 With large fiscal plans coming out of China, the U.S., and the UK, the global commodity complex has caught a bid.
