
Don’t miss our next trade idea. Get on the Bear Traps Report Today, click here
Secular Silver Shift
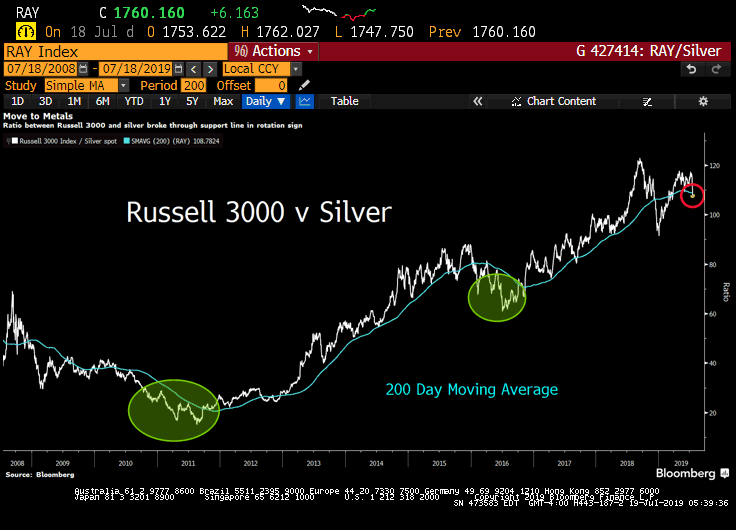 This week, the ratio between the Russell 3000 Index and silver fell below its 200-day moving average, a significant event. In our view, this is a clear sign investors are shifting into asset classes which benefit more substantially from global central bank rate cuts.
With conviction in May, we had clients establish meaningful gold and silver positions, to get on our distribution list, please email tatiana@thebeartrapsreport.com.
Since the Fed’s Dovish Shift in late May
GDX Gold Miners: +40%
SIL Silver Miners: +33%
EWZ Brazil: +25%
GLD Gold: +14%
SLV Silver: +14%
SPY S&P 500: +8%
EEM Emerging Markets +8%
IWM Russell: +6%
Ever since the Fed caved on rate cuts, precious metals and miners saw parabolic rallies. As the Federal Reserve caved on its hawkish policy path and the US Dollar began to weaken, metals have crushed US equities.
Ugly Budget Coming out of Washington
U.S. budget deficit increased by $140 billion during the first nine months of this budget year to $747.1 billion as government revenues and spending both hit records. The Treasury Department reported Thursday that the deficit for the current fiscal year through June is up 23.1% over the same period a year ago with receipts rising by 2.7% while spending increased 6.6%. The Trump administration is forecasting that the deficit for the full budget year, which ends on Sept. 30, will top $1 trillion, up from a deficit of $779 billion last year.
The Recent Surge
At the beginning of June this year, metals began shooting higher once again. Capital crowded in the US Dollar finally began to leave as the Fed guided towards an end-of-July cut. Similar to the beginning of 2016, gold and silver are not taking a breather, investors have had few chances to add on a ‘pullback’.
SLV Silver Trust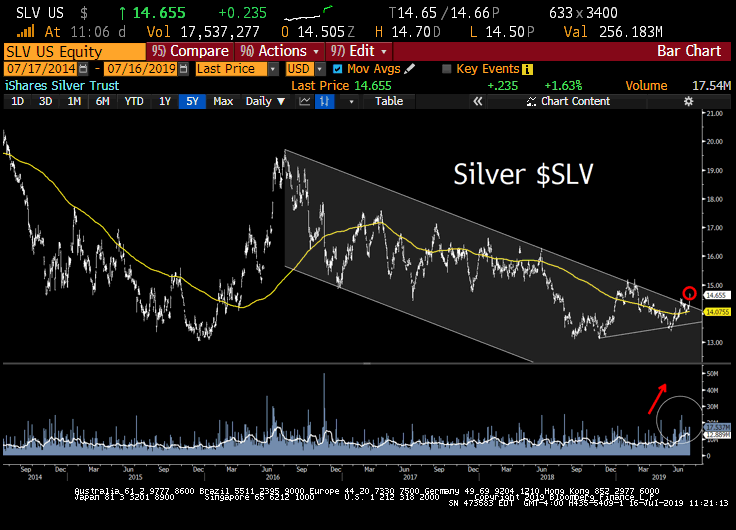 Silver is breaking out of an elongated downtrend to the upside. Precious metals remain one of the best risk/reward trades in the near-term, in our view. Similar to the beginning of 2016 when the Fed caved on their hawkish policy path, precious metals are not taking a breather in their rally higher. Regardless of the global growth trend, a weaker dollar is a major tailwind here. iShares Silver Trust SLV, the average daily volume in May was 6.3M shares and nearly 40M shares were traded on Tuesday. That’s some serious FOMO (fear of missing out) capital flow.
In our view, Sometime in the Next Few Years
1) central banks will run out of stimulant to boost the markets and the economy when the economy is weak.
2) there will be an enormous amount of debt and non-debt liabilities (e.g., pension and healthcare) that will increasingly coming due and won’t be able to be funded with assets.
In Ray Dalio’s view, (we agree) the paradigm that we are in will most likely end when;
a) real interest rate returns are pushed so low that investors holding the debt won’t want to hold it and will start to move to something they think is better.
b) simultaneously, the large need for money to fund liabilities will contribute to the “big squeeze.” At that point, there won’t be enough money to meet the needs for it, so there will have to be some combination of large deficits that are monetized, currency depreciations, and large tax increases, and these circumstances will likely increase the conflicts between the capitalist haves and the socialist have-nots. Most likely, during this time, holders of debt will receive very low or negative nominal and real returns in currencies that are weakening, which will de facto be a wealth tax.”
% of Euro Denominated Corporate Bonds Outstanding with Negative Yields
2019: 13%
2018: 1%*
2017: 2%
2016: 5%
2015: $0
2014: $0
2013: $0
2012: $0
2011: $0
2010: $0
2009: $0
2008: $0
BofA data, BBB investment-grade bonds, nearly 3% of junk bonds trade with a negative yield. Central banks are forcing capital into places it just shouldn’t be, moral hazard squared. Over the last 40 yrs, we’ve been lectured on the relationship between gold/silver and inflation, but it’s really about price stability. Markets have been pricing in deflationary risks for much of this year. Central banks lose control of prices = precious metals tailwinds. The explosive growth in negative-yielding corporate bonds points to global deflation risk on the rise, that’s FAR from stable prices, gold and silver are sending an important message.
*Dec 2018 data
Sovereign Defaults Piling Up last 10 Yrs
Greece
Jamaica
Belize
Puerto Rico
Iceland
Grenada
Barbados
Venezuela
Argentina
Ukraine
Ecuador
Turkey?
Mathematically unsustainable promises to voters. Populists on the left want to walk away from colossal debt obligations, on the right they want tax cuts.
Credit, Capitalists, and Socialists
At the same time, Ray Dalio points out there will be greater internal conflicts (mostly between socialists and capitalists) about how to divide the pie and greater external conflicts (mostly between countries about how to divide both the global economic pie and global influence). In such a world, storing one’s money in cash and bonds will no longer be safe.
Global Corporate Bonds at Negative Yields
2019: $623B
2018: $12B*
2017: $90B
2016: $226B
2015: $32B
2014: $0
2013: $0
2012: $0
2011: $0
2010: $0
2009: $0
2008: $0
Bloomberg, DB data
*Q4 December
Central banks are forcing capital into places it just shouldn’t be, moral hazard squared.
As the Fed Softens their Policy Path, HIGH Impact on Emerging Market Financial Conditions
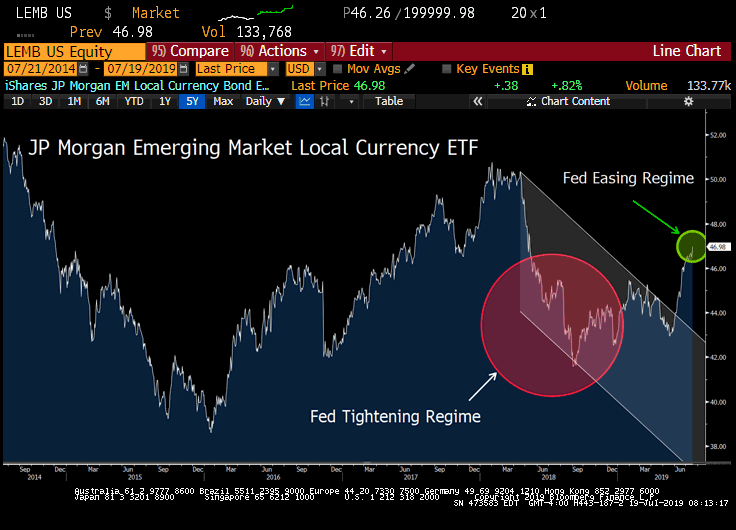 Rate cuts get vaporized in a swift economic downturn. The Fed is saying (this week’s John Williams speech), if they cut now – with force – while the US economy still has momentum, we’ll actually have a chance at creating inflation, and avoid deflation and the negative rate trap in Europe and Japan. The impact on global financial conditions, relative to Fed policy is on stage here (above). Emerging market local currency debt has caught a meaningful bid.
Investors Beware
“Bonds are a claim on money and governments are likely to continue printing money to pay their debts with devalued money. That’s the easiest and least controversial way to reduce the debt burdens and without raising taxes. My guess is that bonds will provide bad real and nominal returns for those who hold them, but not lead to significant price declines and higher interest rates because I think that it is most likely that central banks will buy more of them to hold interest rates down and keep prices up. In other words, I suspect that the new paradigm will be characterized by large debt monetizations that will be most similar to those that occurred in the 1940s war years. So, the big question worth pondering at this time is which investments will perform well in a reflationary environment? A world with large liabilities coming due and with significant internal conflict between capitalists and socialists, as well as external conflicts. Most people now believe the best “risky investments” will continue to be equity and equity-like investments, such as leveraged private equity, leveraged real estate, and venture capital, and this is especially true when central banks are reflating. As a result, the world is leveraged long, holding assets that have low real and nominal expected returns that are also providing historically low returns relative to cash returns (because of the enormous amount of money that has been pumped into the hands of investors by central banks and because of other economic forces that are making companies flush with cash). I think these are unlikely to be good real returning investments and that those that will most likely do best will be those that do well when the value of money is being depreciated and domestic and international conflicts are significant, such as gold. Additionally, for reasons I will explain in the near future, most investors are underweighted in such assets, meaning that if they just wanted to have a better-balanced portfolio to reduce risk, they would have more of this sort of asset. For this reason, I believe that it would be both risk-reducing and return-enhancing to consider adding gold to one’s portfolio. I will soon send out an explanation of why I believe that gold is an effective portfolio diversifier.”
Ray Dalio, July 2019
Gold to Silver
Although gold and silver rally in tandem, silver has historically outperformed when both are spiking (see 2016 results). Meanwhile, the ratio of gold to silver is just off 30 years highs! In our view, there is significant ground for silver to catch up here.
Gold to Silver Ratio 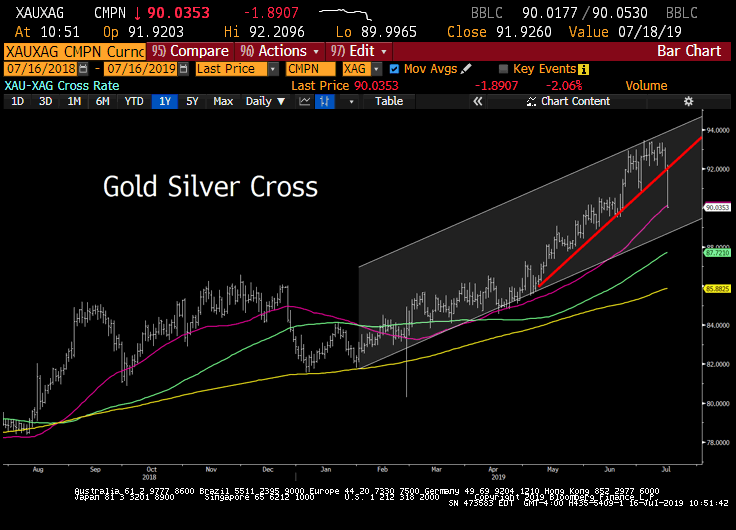 Metals continue to be strongly bid as gold and silver miners are rallying again this week despite a stronger US Dollar. Silver also significantly outperformed gold again. We highlighted this in our client chat recap yesterday, capital flows from gold to silver, are picking up steam. As we have stressed to clients throughout the last month, overweight silver here.
Bloomberg Nickel Subindex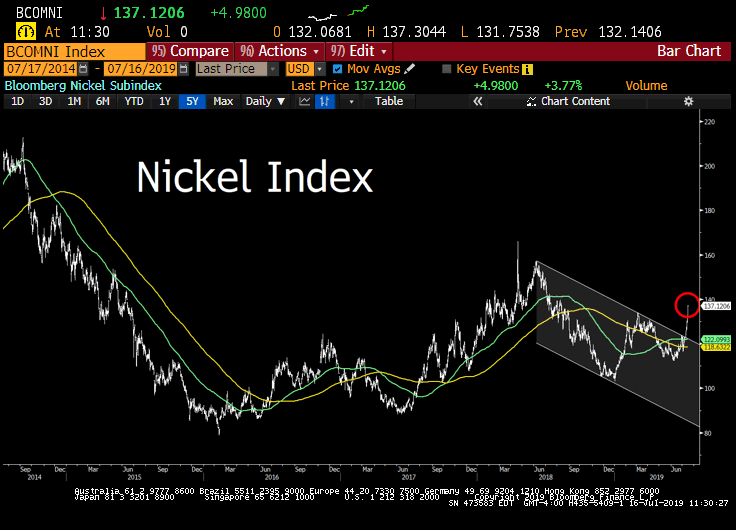 One reason why silver has begun to outperform gold so much is that it is following the price of Nickel. Futures in Nickel have broken out to a parabolic-like rally, up almost 20% since late June and up over 30% since December. Although the dovish Fed guidance has been a major contributor to the Nickel rally, the industry has also been supported by supply-side reductions in recent weeks. The earthquake that hit Indonesia, as well as continued production cuts from Brazil’s Vale, have added to the upside price pressure.
Don’t miss our next trade idea. Get on the Bear Traps Report Today, click here
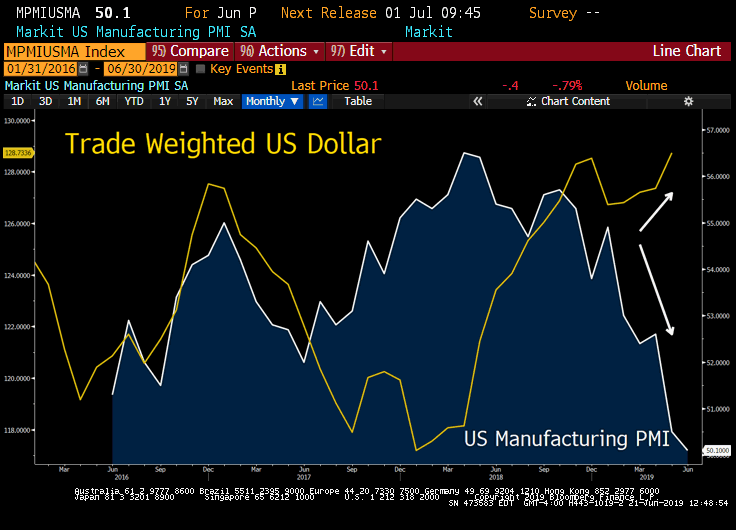 There are a thousand words in this chart. As we witnessed in 2015-16, a strong US dollar hammered the US manufacturing sector and jobs were put at risk. Today, US Manufacturing PMI is essentially in recession territory (a reading below 50 signals recession). A strong US dollar has made exports far more expensive, especially in Europe with their central bank – the ECB – in currency manipulation mode for much of the last 3 years.
 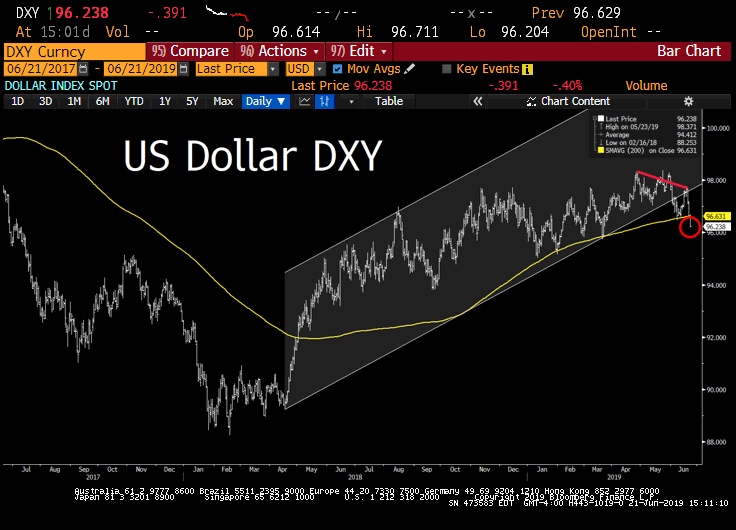 Goodnight Irene, the US Dollar has broken its uptrend which started in January of 2018. This is the beginning of a meaningful leg lower. The Fed has laid a beating on the global economy with eight rate hikes and $666B balance sheet reduction, all since 2016. That’s a colossal amount of tightening compared with the rest of the world. As they unwind this experiment, the greenback is in big trouble. We believe the Dollar is putting in its top, stuck in a dynamic where it’s a victim of its own success. If the Dollar breaks out to new highs, it will find itself in a tricky balance — more global economic destruction and an even greater need to cut rates. A significant weight on the Fed in its recent meetings has been the powerful force in their embarrassing U-turn — the slowdown in global growth and the negative feedback loop back to the U.S. In recent years while the Fed was in crack smoking mode — trying to hike rates and reduce its balance sheet by trillions at the same time — trillions of Dollars ($6T to $7T in our estimates) were sucked back to the United States and the emerging market’s economic engine was the big loser. This giant ocean of capital is about to change direction and Dollars will be pouring out of the U.S.
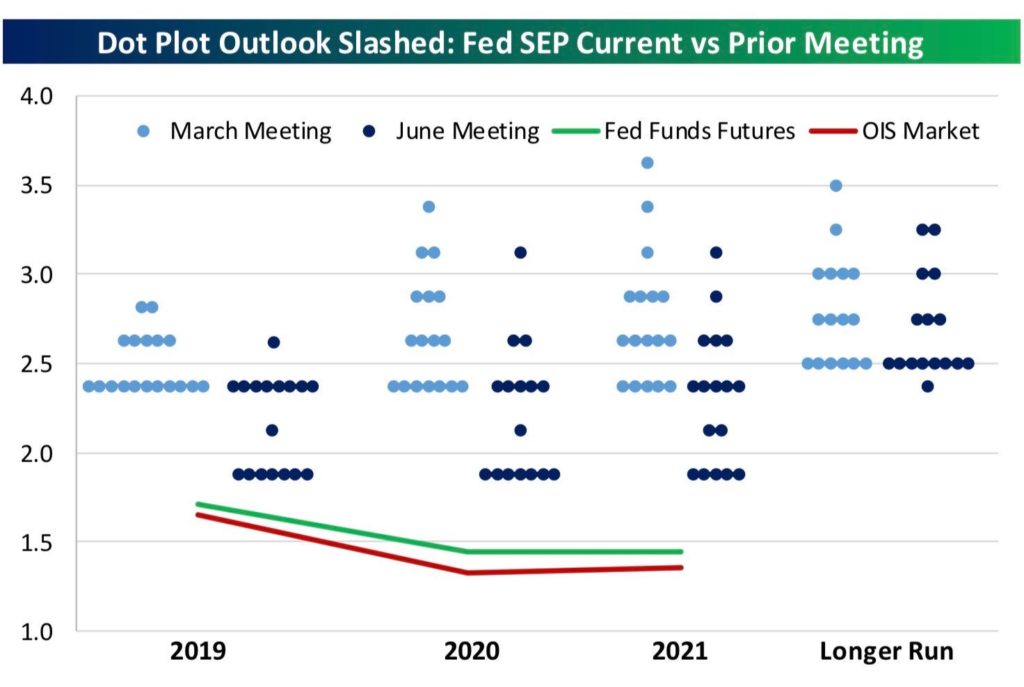 Nine members see no rate cuts this year, eight do (of which seven see two cuts). The committee changed language from its May statement and took out the 2020 rate hike.
 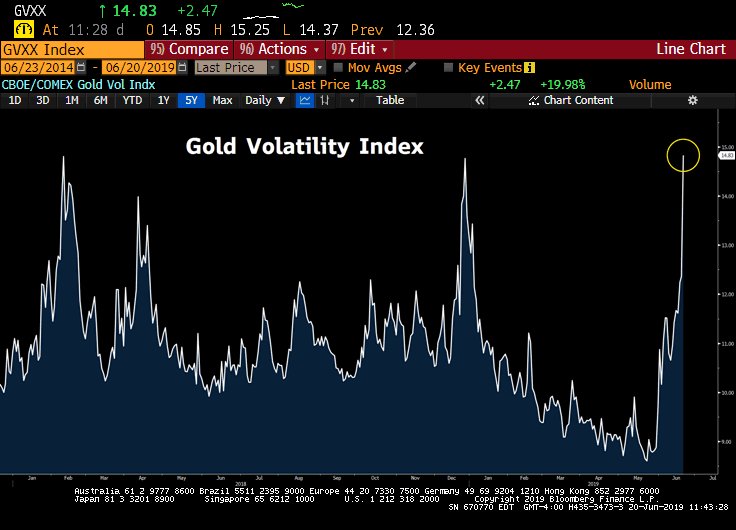 The Fed’s cave led to the largest one-day volatility spike in Gold since Feb 11th, 2016. That day gold closed up 4%, consolidated its move over 2 days then continued its uptrend to a top 4 months later.
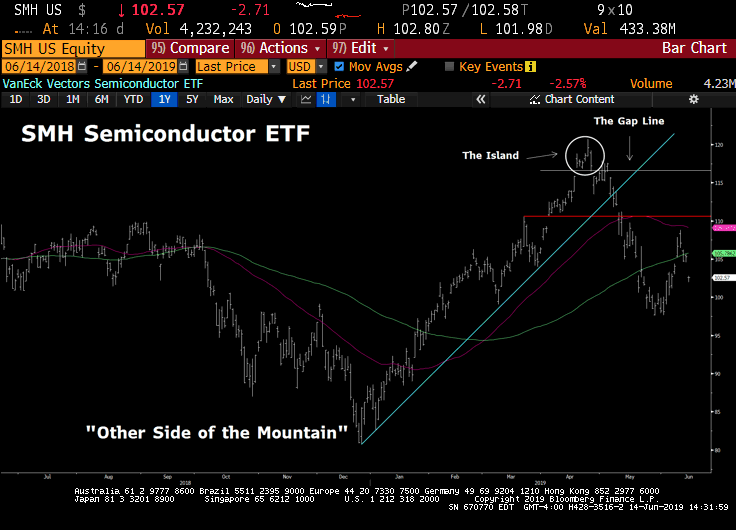 Part I: The possibility of an island: In April, the SMH Semiconductor ETF enjoyed a parabolic (and, by implication, unsustainable) rise dotted by a plethora of up gaps, indicating desperation to buy. The April 3rd gap was particularly impressive, as there had been a violent up-move day in late March which was immediately reversed in dramatic fashion in the next one and a half trading sessions. The April 3rd gap happened at the peak of that reversal.
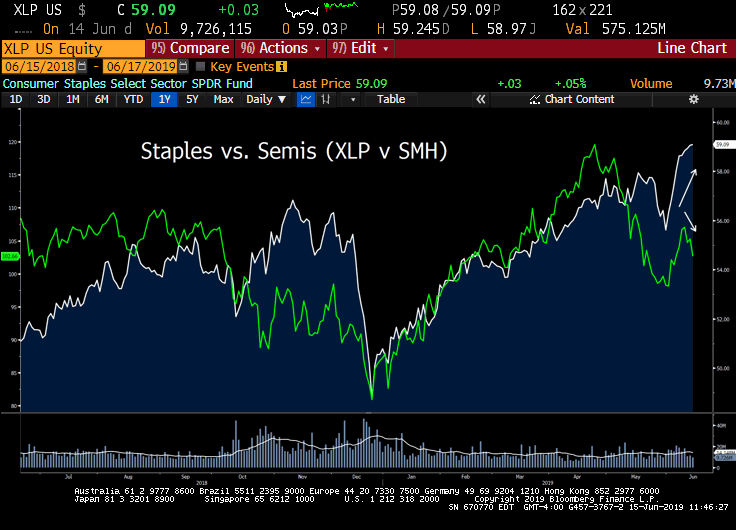 A meaningful rotation is in the works here, near historic proportions in our view. Slow growth consumer staples have outperformed growth stocks in the semiconductor sector by 2200bps (22%) over the last year.
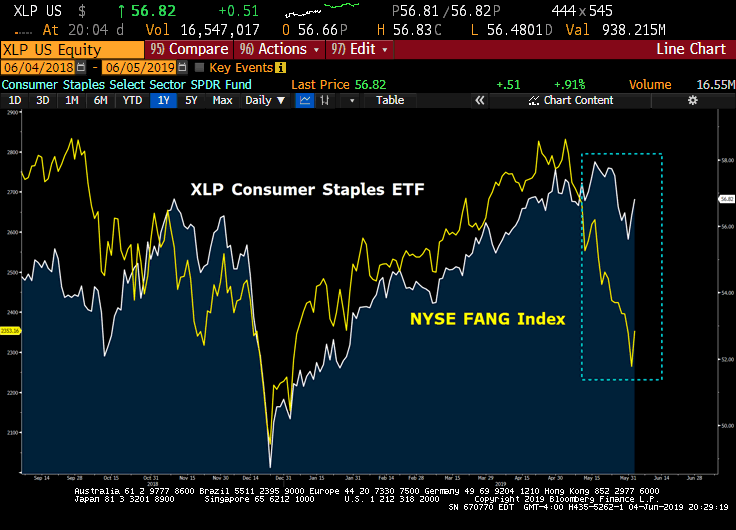 Over the last few weeks, we’ve seen a divergence between Consumer Staples (XLP) equities and the FAANGs (FANG). This indicates that money is pouring into defensive stocks as investors sense trouble brewing.
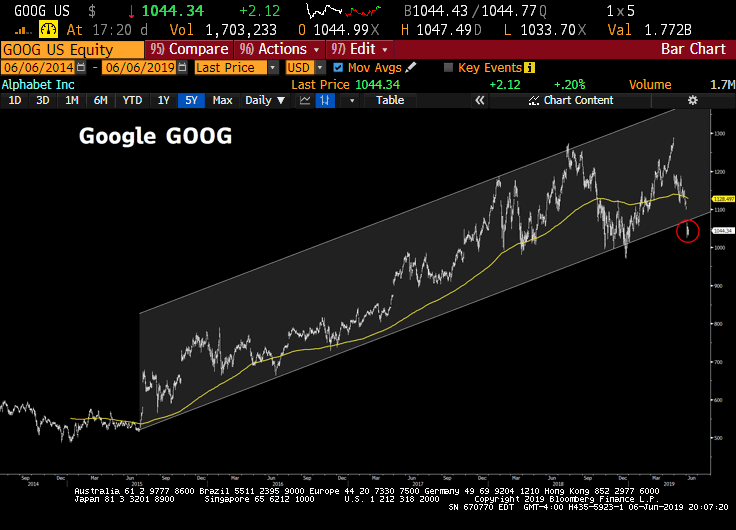 FAANG stocks had their ninth-worst intraday loss ever on the back of last Monday’s antitrust news (when aggregating their market capitalizations). Facebook was down 7% on the day, while Amazon and Google were down 4.5 and 6%, respectively. Google also broke a four-year trend channel to the downside – look out below. As the political tug of war escalates, we will likely see more announcements from regulators and more shocks to the FAANGs
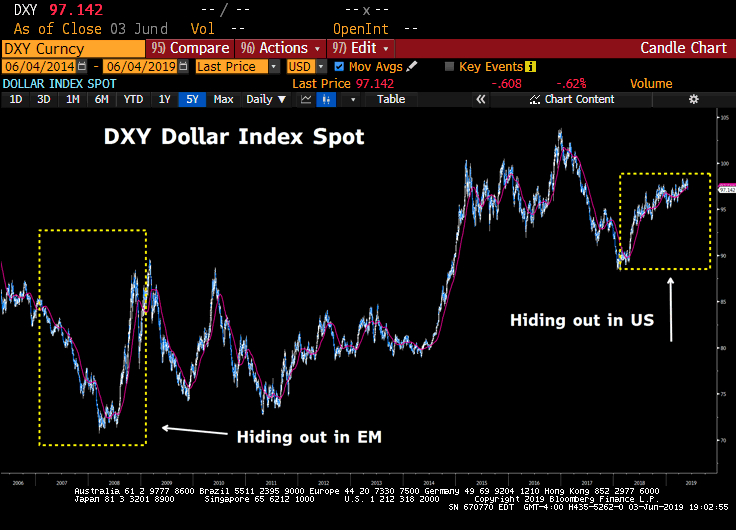 Today, the crowding in US Dollar assets is the antithesis of the emerging market lovefest circa 2006-7. Prior to the Great Financial Crisis, investors were flooding into emerging markets as US data began to deteriorate, leading EM being perceived as a safe-haven. “They’re building 100 Chicago’s in China don’t you know?” The consensus view was emerging markets had ‘decoupled’ from the US. EM bulls touted that neither Bear Stearns’ collapse nor the struggling and over-levered Lehman Brothers mattered — emerging markets were the ‘safe place’. High kites indeed, last 10 years the S&P is up 267% vs. the iShares China Large-Cap ETF’s paltry 31% for the on a total return basis. However, once the US-born recession washed-over on emerging market shores, the flood of foreign capital rushing back into the US Dollar was colossal. In our view, the opposite dynamic is playing out today. A global trade triggered slowdown is causing investors to hide out in US assets (S&P 500, Treasuries, USD). We believe a capital flood out of the US is on our doorstep.
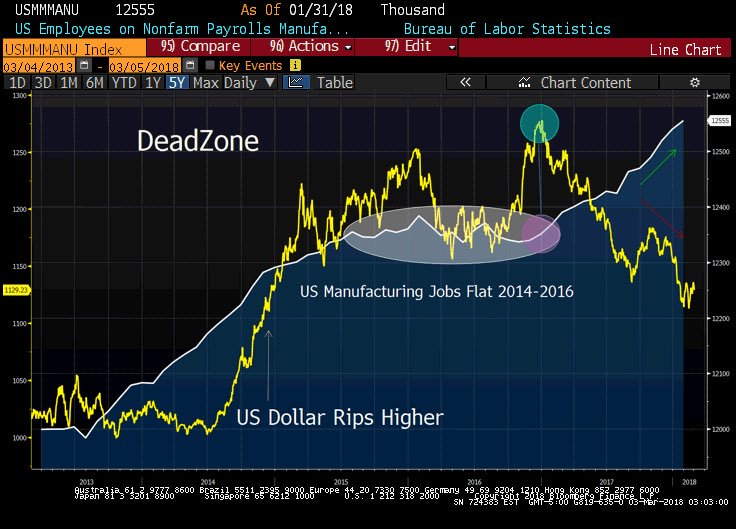 Heading into the 2020 election, there are few things Treasury Secretary Steven Mnuchin, OMB Director Mick Mulvaney, and of course President Donald Trump want more than a weaker Dollar. It’s probably not too much of a stretch to say that the Dollar’s 2014-2016 surge delivered Michigan, Wisconsin, and Pennsylvania to Trump on the back of undermined manufacturing and exports (see above, DeadZone). The President clearly knows this and it’s part of the reason for his regular tweets and comments lamenting Powell’s interest rate hikes. USD bulls — beware!

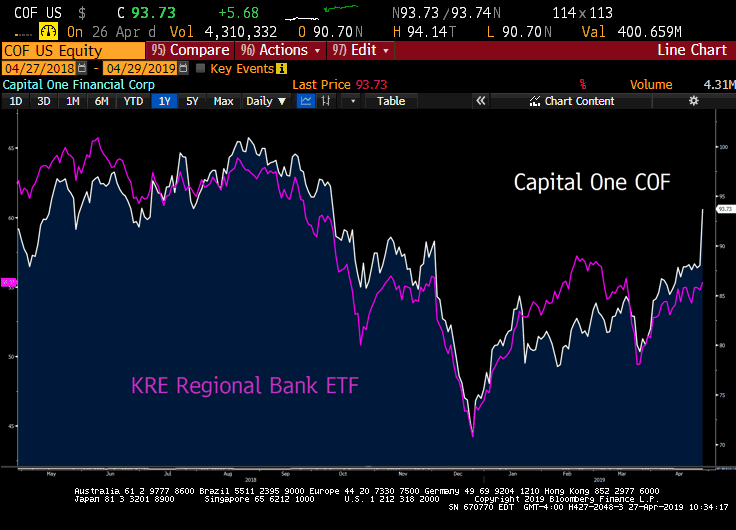 Capital One COF was a standout this week, we noticed significant divergence to the upside relative to regional bank equities. A short squeeze was in play in our view, short interest in COF shares rose to nearly 6m shares in Q1, up from 3m shares short in September 2018. Strong earnings results were the driver of the squeeze, the company also put forth initiatives to boost margins as it lays out a path to become more efficient. It’s important to note, few stocks actually lost too much ground in Financials as the sector was firm this week but trust bank State Street STT was the worst performer. Organic growth at Trust Banks is facing a number of headwinds.
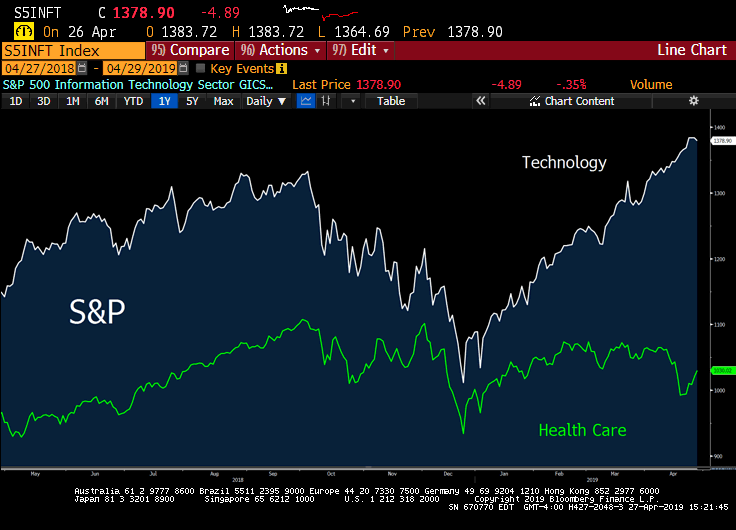 The driving theme for the week across asset classes may have been the increasing emergence of relative value trades even as the S&P 500 Index climbed to a new all-time high. To be sure, being ‘long & strong’ has paid off for US stock investors again in April — the S&P 500 is up over 3.5% for the month. But April has also brought even greater returns from relative trades such as long Tech/short Healthcare or long the dollar vs. the euro over the past week.
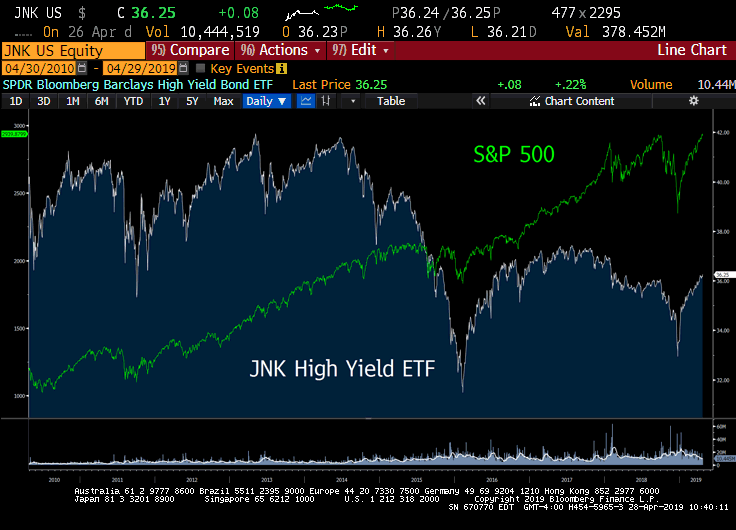 Stocks are partying like it’s 1999, while junk bonds are showing signs of cracking. We’re looking down the barrel of a high pace of credit rating downgrades. Per S&P Ratings this year, the ratio of downgrades to upgrades is the worst since 2016’s energy price collapse, back then oil was $26 vs. $64 today. We’re seeing a sharp breakdown, a meaningful underperformance of poorer quality credits. Credit deterioration is picking up even with CCC high yield index up +10.1% YTD, Q4 loss was near -10%. If you look at the frequency of bonds in a -20% or more hole (substantial sell-off in price), in 2019 we’re at double the pace of 2017 in terms of blow-ups in the CCC corporate bond space.
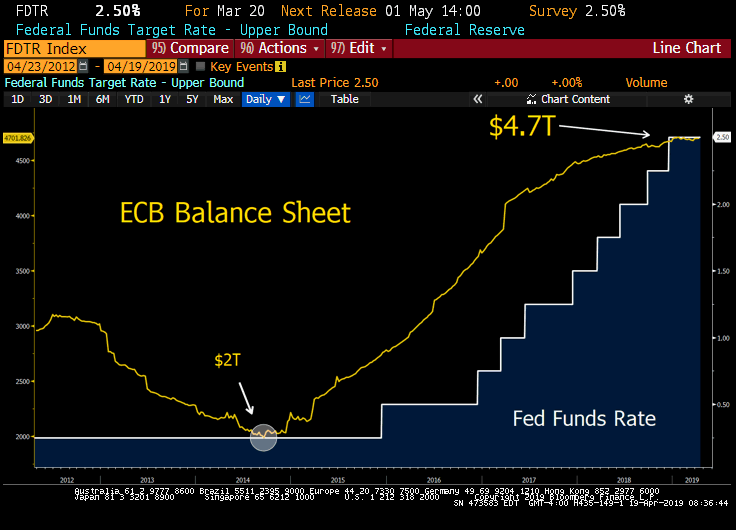 It’s kind of a mind-blower. Since 2014, the European Central Bank has been in accommodation mode to the tune of a $2.7T bond-buying spree (see above) found in their colossal balance sheet expansion. At the same time in the U.S., the Federal Reserve has hiked rates nine times, eight since the 2016 election and REDUCED its balance sheet by $500B. Is the U.S. economy that much stronger than Europe’s? Clearly, there’s $62T of GDP OUTSIDE the U.S. and $18T inside – so Fed rate hikes tend to do a number on the global economy which feeds back to Europe in a negative way, which then comes back to the U.S. and stopped the Fed in its tracks (in Q1 the Fed put forth one of the most significant policy reversals in the history of central banking). A five-year-old can tell you this is a broken model. You can’t have one central bank hiking rates nine times in 3 years, and another buying up nearly $3T of global assets – markets just told us this is a highly unsustainable dynamic in modern central banking. We believe the Fed, ECB, PBOC (China), BOE (UK) now get the joke. Looking forward – we see a “convergence” in global central bank policy, NOT unsustainable divergence. This will have MAJOR implications for the dollar, precious metals and emerging market equities. Pick up
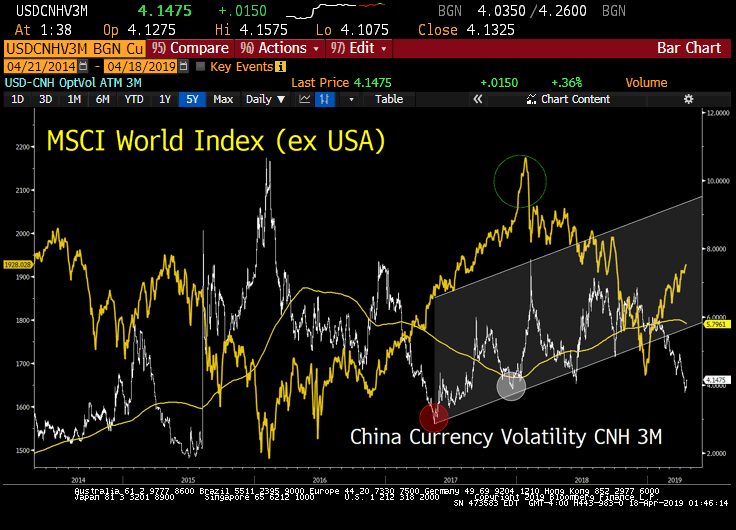 Today, economic demand struggles are bottoming globally, and the Yuan (China currency) is beginning to strengthen. One of our favorite global economic indicators is found in 3-month China yuan volatility. As a currency is strengthening volatility plunges, while a weaker currency is often met with a surge in forex volatility. Looking back over the last 5 years you can see – above- the powerful impact on global equities. There’s an inverse relationship between equity prices globally and China forex vol. BUT, but , but; above all, the last time China currency volatility was this low, global equities were a lot higher – see the grey circle above.
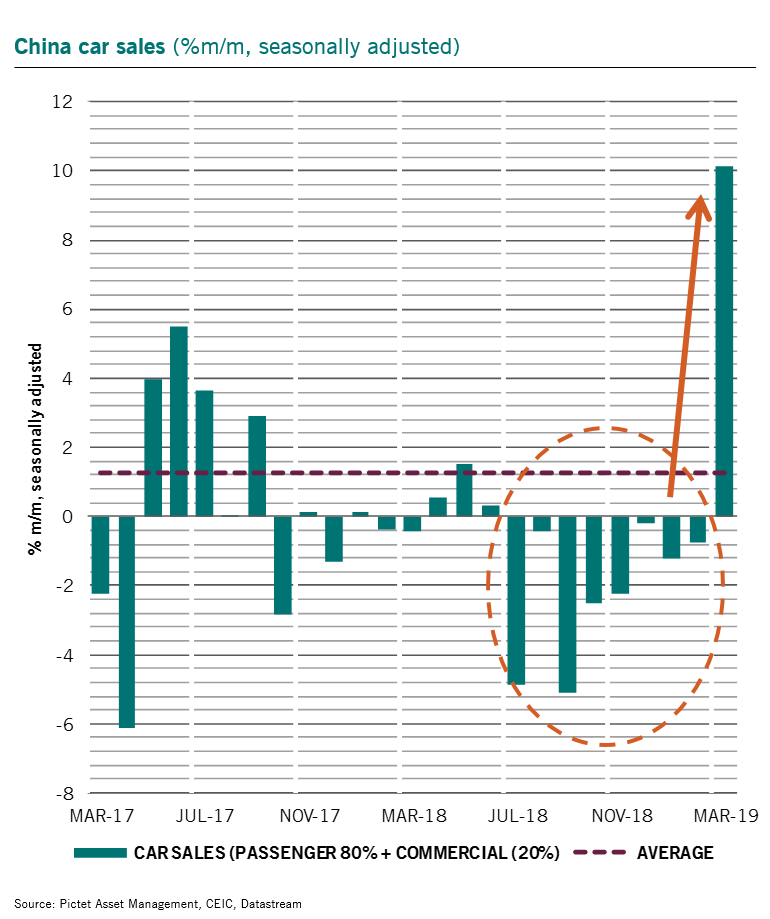 China’s easier economic policies transmission to consumption has not convinced so far. March jump in car sales may be the 1st sign of this happening. Car sales rose more than 10% over the month (strongest since April 2009), reversing the y/y trend growth from 22-year lows. Special thanks to our friend Patrick Zweifel and Pictet Asset Management for this observation.
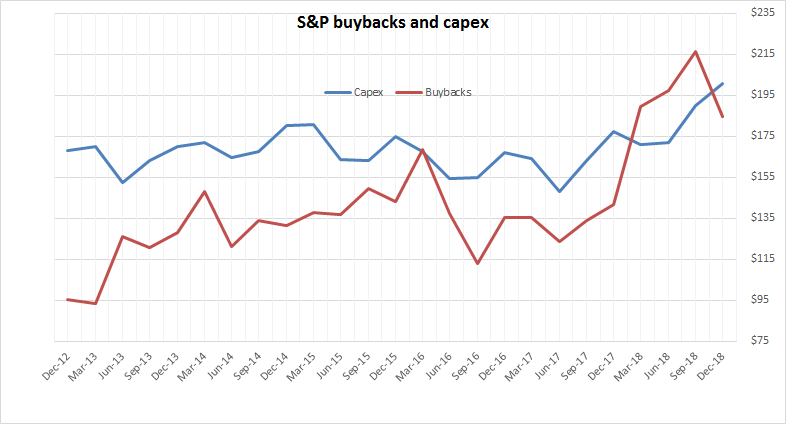 Our Bear Traps Report team developed this thesis in early January – see our chart above. We’re pleased to say, NOW Goldman is backing up our work. It’s very disturbing that the main street media continues to spin a narrative which is completely false. When looking at the numbers, Goldman’s US portfolio strategists David Kostin and Cole Hunter find many of these arguments (Buybacks > Capex) don’t hold up in reality! In particular, they emphasize that even as companies return a large amount of cash to shareholders, there is sizable reinvestment; in fact, growth investment at S&P 500 companies has accounted for a larger share of cash spending than shareholder return every year since at least 1990, with the largest share repurchasers far outpacing market averages in the growth of R&D and capex spending. They also find those executives who stand to gain the most from buybacks— those whose compensation depends directly on EPS—did not allocate a greater proportion of total cash spending to buybacks in 2018 than executives whose pay was not linked to EPS.
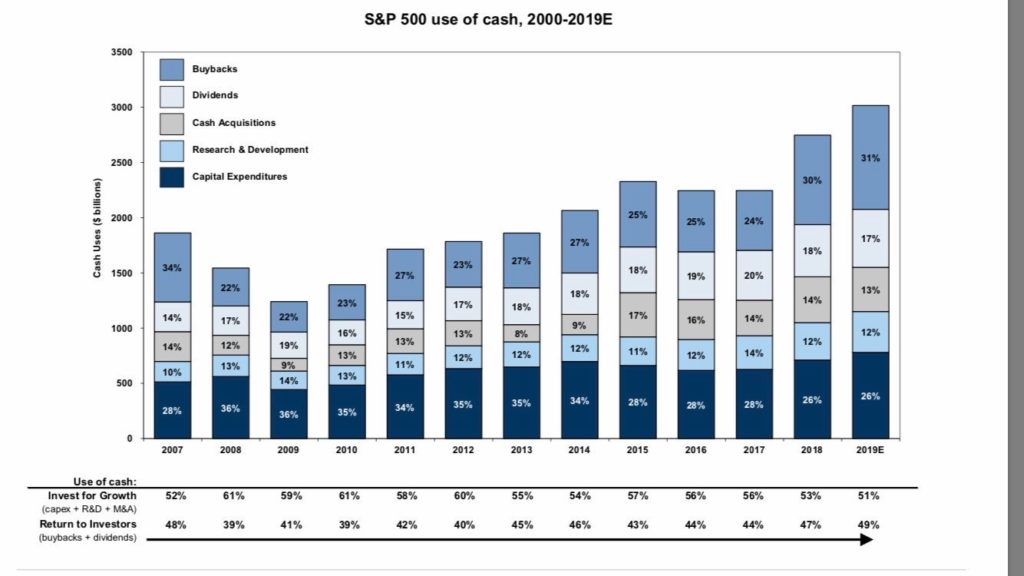 Aswath Damadoran, professor at New York University Stern School of Business, agrees that buybacks aren’t coming at the expense of investment. Rather, he argues that large, mature companies returning cash to shareholders allow that cash to be put to more productive uses; so it’s not that companies are investing less, it’s those different companies—with better growth opportunities—are investing instead.
