
*ECONOMY IN U.S. GREW 1.2% IN SECOND QUARTER VS 2.5% FORECAST
*U.S. FIRST-QUARTER GDP REVISED DOWN TO 0.8% FROM 1.1%
Don’t miss our next trade idea. Get on the Bear Traps Report Today, click hereThis week, the Federal Reserve talked up a chance for rate hikes this year while economic growth (as measured by GDP) has been in sharp decline over the last three quarters.
“The Fed is out to lunch, do they look at what’s going on in the economy? It’s unbelievable.”
Jeff Gundlach, July 29, 2016
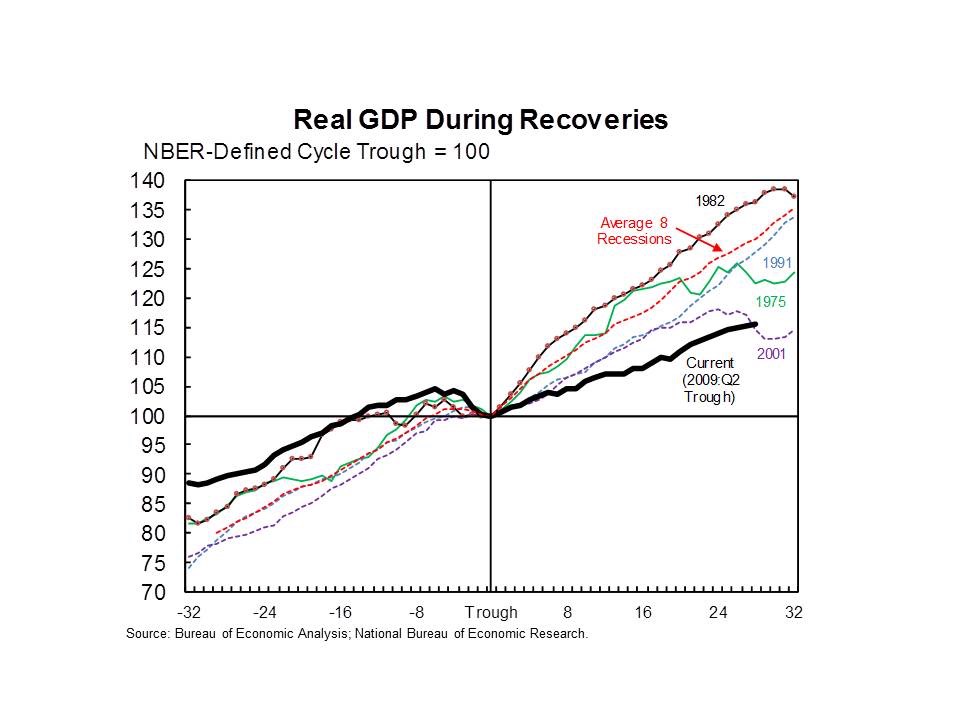 The path of the current U.S. economic recovery (black line) in nearly 2 standard deviations below the average since 1970 (red line). At nearly 20x trailing 12 month earnings;
“stocks have reached today’s valuations only ahead of the three largest equity market declines in the last century.”
U.S. Treasury’s Office of Financial Research, July 29, 2016
Don’t miss our next trade idea. Get on the Bear Traps Report Today, click hereQ2 Earnings in the S&P 500
Of the 363 companies reporting, we’re looking at a 3.2% plunge in earnings, that’s the 4th consecutive quarter in negative territory. Top line revenues were off 0.1% year over year. S&P 500 companies derive 40-45% of their sales outside the USA, as the dollar has surged over the last 18 month, it’s leaving a stain on earnings.
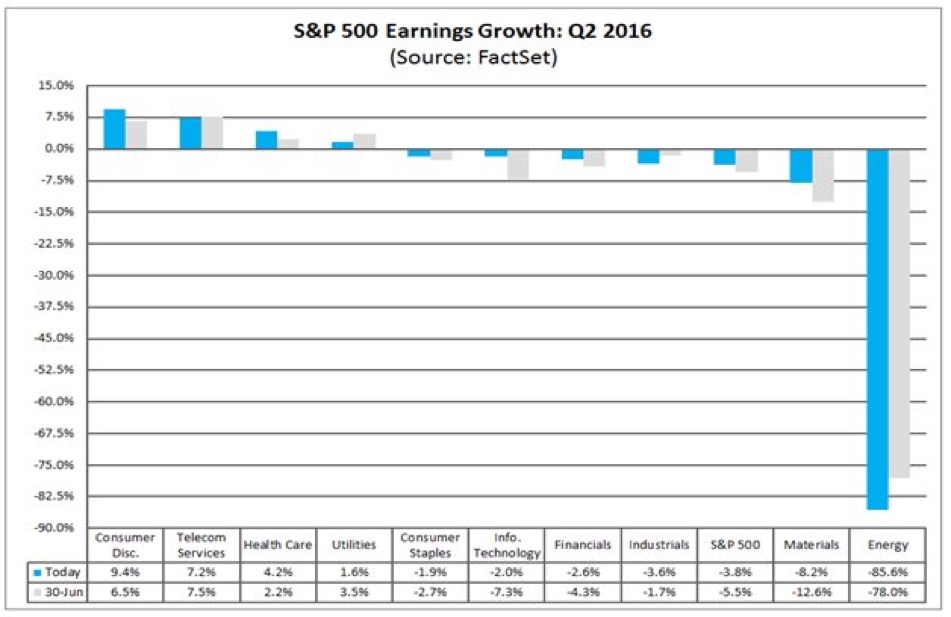
The second quarter will mark the first time the index has recorded five consecutive quarters of year-over-year declines in earnings since Q3 2008 through Q3 2009. We have never seen this kind of an earnings contraction outside a recession. Pick up our best ideas here:
Don’t miss our next trade idea. Get on the Bear Traps Report Today, click hereLower and Beat
For Q3 2016, 36 companies have issued negative EPS guidance and 20 companies have issued positive EPS guidance.
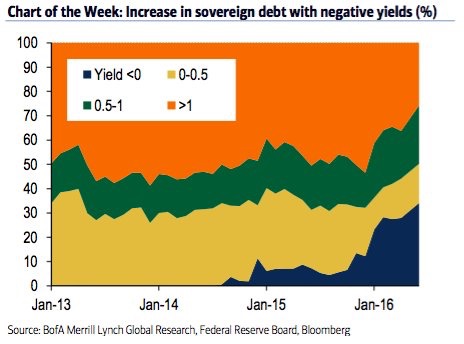 The global corporate earnings recession coupled with a sharp decline in GDP has ugly side effects. The percentage of government debt with more than a 1% yield has plunged from 61% to 31%, central bankers are forcing capital into places it just shouldn’t be.
Cooking the Books
When actual GAAP earnings for the S&P 500 were stagnant from 2012 through 2016. But when companies used non-GAAP methods, earnings were up 14%, WSJ data shows.
 Fed’s 5 Year 5 Year Forward measures where investors expect inflation to be in the five-year period starting five years from today. As of Friday, the five-year, five-year stood at 1.39%, that’s down sharply from the 1.74% level the last time the Fed hiked rates. U.S. net domestic private business is off by 20% over the last 18 months. Publicly traded corporations seem more inclined to use low borrowing rates to pump debt into their balance sheets (through, say, share buybacks) than to invest in growth.
The “Strong” U.S. Recovery
The U.S. economy expanded less than forecasts in Q2 after a very soft start to the year. The results were much lower than previous estimates as companies slimmed down inventories.
Capex Hangover
2015: 4.0%
2014: 6.1%
2013: 5.5%
2012: 10.4%
2011: 12.2%
Once again, Capex (capital expenditures) was very weak, corporations remained concerned of investing amid shaky global demand. Non-residential fixed investment plunged another 2.2%, the third straight quarter in negative territory.
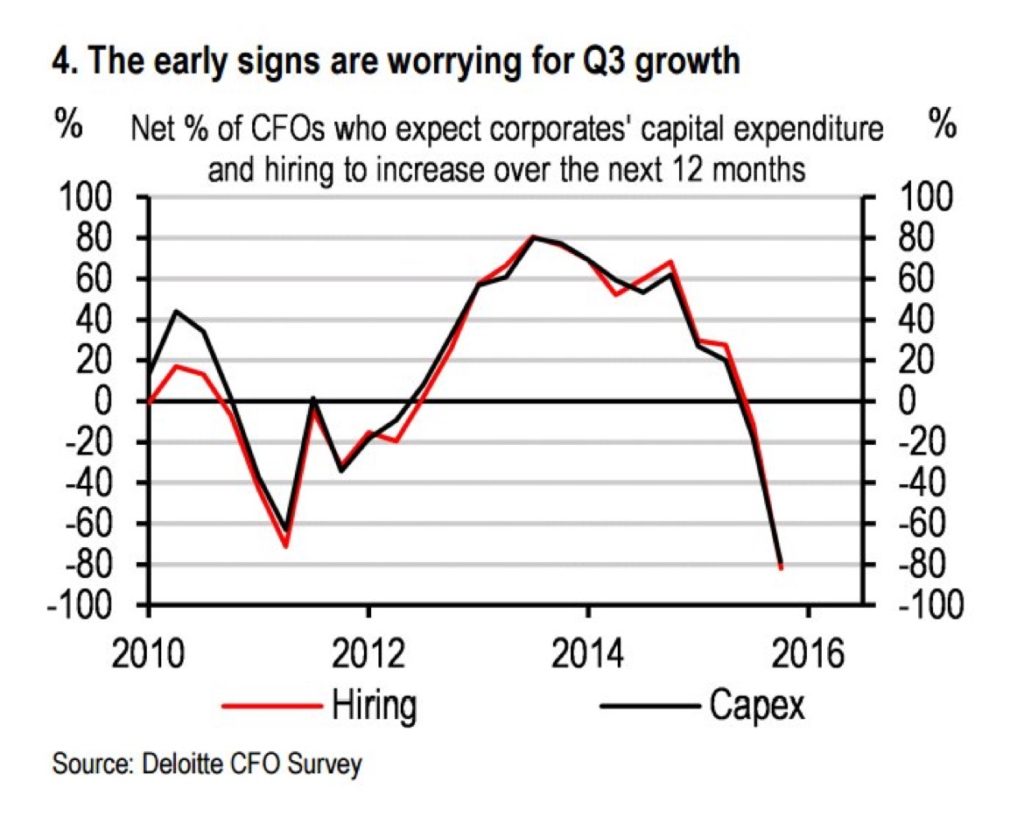
Political uncertainty is putting substantial pressure on GDP. U.S. companies are frozen, an image of “deer in the headlights” comes to mind. Capex is the mothers milk to sustainable job creation, it’s just Not there. Looking out over the next 12 months, over 80% of CFOs say they do not expect to hire more employees or expand capex.
 In the battle of Fed branches, the New York Fed had Q2 GDP 2.2% while the Atlanta Fed had economic growth at 1.8%, both estimates are way off the economic reality. We must start to think about risk management and the 2016 election. In 2012, President Obama had GDP up near 4%, Hillary Clinton is looking at an average of 1% over the last three quarters.
Monday: 50%
Gross domestic product rose at a 1.2 percent annualized rate after a 0.8 percent advance the prior quarter, Commerce Department figures showed Friday in Washington. The median forecast of economists surveyed by Bloomberg called for a 2.5 percent second-quarter increase.
 The Citi economic surprise index fell from above 40 to 16 on the Q2 GDP miss.
Unanualized GDP grew 0.3% in Q2, in line Eurozone. Futures market now has the first rate hike “fully priced” close to December 2017, that’s using the mid range of the band. In Q4 of 2015, the Fed hiked rates into 0.9% GDP (Q4 QoQ real GDP). The media Fed dot (their expectations of the Fed funds rate) for December 2017 is up at 2.37%, a far cry from where the futures are.
Don’t miss our next trade idea. Get on the Bear Traps Report Today, click hereThe U.S. economy has to grow above 4% in Q3 and Q4 to equal 2015’s 2.6% GDP growth.
 The two year U. S. Treasury has been the gift that keeps on giving, every sell off has been a buy this year.
Fixed Investment dropped most in seven years. Personal consumption came in as expected, but the highest since Q4 2014. The ugly data Means Fed will keep rates lower for longer. Odds of December Fed rate hike are now at About 43%.
Don’t miss our next trade idea. Get on the Bear Traps Report Today, click hereQ1: 0.8%
Q4: 0.9%
US Stimulus 2008-2016

