Our Best Ideas await you, Get on the Bear Traps Report Today, click here
Join our Larry McDonald on CNBC’s Trading Nation, Wednesday at 2pm.
In 2007, Larry led a team at Lehman Brothers to capture over $100m in bets against the subprime mortgage crisis. Here’s what he has his eye on today.
“If we look at the Fed’s forecast of where they think their Fed Funds Rate will be at the end of 2016, it’s up at 1.625%. That’s five 25bps hikes over the next year? Look for this number to come down substantially, the US 10 Year note is heading below 1.50%.”
Bear Traps Report, September 2015
The Longest Runs with Rates Near Zero
1932-1953: 21 years
2008-2016: 8 years
2001-2004: 3 years
The U.S. has had near zero short-term interest rates before. The period of 1932 to 1953 was defined by rates that were between zero and 2.1%. The last time we hit the zero bound, we stayed very close to it for upwards of 21 years. This is not something you hear often from economists these days.
Lower yields for longer periods of time bring out the animal spirits in investors, the reach for reach for yield gets more excessive EVERY minute interest rates are kept at ridiculously low levels.
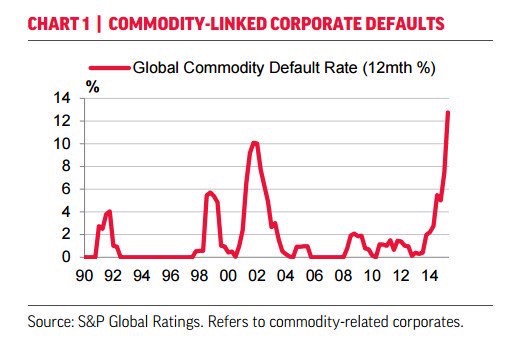
U.S. Speculative-Grade Corporate Default Rate Increased To 4.1% in May, highest since September 2010, which saw the rate at 4.2%.
U.S. Household Net Worth
Central Bankers Giveth, but they Will Take it Away
The main reason central banks raise and lower rates is to shift consumption around and smooth out periods of stagnation. The Fed’s dual mandate of non-accelerating inflation and full employment defines the characteristics of the smoothing that society wants to see.
The number of U.S. corporate high-yield bonds on negative rating watch has risen 26 percent in the past year due to increasing leverage and a poor liquidity outlook. As of June 30, 2015, the list of corporate high-yield bonds on negative watch by one of the three major rating companies as of that date was 119. Today, this number has surged 26 percent to 149 bonds, even as yields have fallen. Lower credit quality and lower yields is the evil side effect of modern central banking.
U.S., Italy and Spain 10 Year Bonds
In a powerful move, Spain’s 10 year bonds have plunged in yield. Last week at 1.63% to 1.14% as of Friday’s close. Mario Draghi and the ECB brought out the fire hose to contain markets. Just a leaked story to the press over a possible “Capital Key” expansion had shorts running for cover and buyers stampeding in. It’s amazing how regulators are putting stock market players in jail for trading on “inside information” while central bankers are creating their own every other week. Expanding the capital key would allow the ECB to buy even more, low credit quality, periphery (Spain, Italy) debt. Today, investors receive 0.30% more interest buying a U.S. 10 year bond over Spain’s 10 year. Front running the ECB has become a national pastime in Europe. As someone who sat on the deck of the Titanic that was Lehman Brothers, this is pure evil, central bank induced moral hazard gone rogue.
Since 2008, $33T of wealth has been created in the USA. The Trillion Dollar question? What is the U.S. ‘s aging population doing with all this money? Buying bonds that have doubled in value? Lending money to commodity companies (oil), financing more exploration and excess supply? We have a global, aging population positioning capital in places it just shouldn’t be, all because of central bankers.
U.S. Population 45-64
Demographics, the Fed and Wealth Destruction
There are powerful dynamics hidden inside today’s bond and commodity bubbles that once again clueless central bankers are missing. There are nearly 4m more Americans age 45-64 today than there were for years ago. Where are these high net worth investors being forced to put there wealth? Developed markets around the globe are experiencing the same problem. Aging populations after years of wealth creation equal a lot of investors with limited choices, so they reach for yield. Investors are putting capital in places it just shouldn’t be and central bankers are holding the smoking gun. They successfully blamed Wall St. for the financial crisis and hid behind the shadow of a tragedy, they will not be so fortunate when markets turn on them again.
Everyday nearly 11,000 people in the USA Turn 65
% of Population Over 65 of Age
Japan: 28%
Germany: 22%
Spain: 22%
Italy: 22%
USA: 15%
Bloomberg
Low rates pull consumption and investment forward and allow projects to be undertaken that otherwise would have to wait. Some people call this stealing economic activity from the future, but we must keep our eye on the incentives created by Fed policy.
U.S. 30 Year Mortgage Yield vs. the S&P Case Shiller Average Home Price
This is a very interesting look at the S&P / Case Shiller U.S. Home Price Index vs the U.S. 30 Year Mortgage Rate. We must learn from financial history, clearly Fed policy had a heavy hand in inflating the U.S. housing bubble. What are their policies disrupting today? Over the years, each financial crisis experiences a metamorphosis into another serpent, another beast. We must prepare for what is coming at us.
On the other hand, higher rates make debt more expensive and push consumption and investment out. Over the last year, most economist have felt the Fed is looking to “tap the brakes” on the improving U.S. economy. Wall St has been wrong yet again, they’re the gang that can’t shoot straight.
Our Best Ideas await you, Get on the Bear Traps Report Today, click here
Excessive Debt: Handcuffs Or A Noose?
The other pressing issue is high debt levels. The Fed is in no hurry to hike rates with debt levels so high in the post-Lehman era. The U.S. hit its debt ceiling in March of 2015, at $18.1 trillion, but the devil is in the details, or what’s called interest costs as a percentage of federal spending. As you can see below, net interest outlays are on course to more than double by 2017 from 2005 levels. Interest costs on the staggering U.S. debt load, added together with government entitlement spending, is nearing 71% of Federal spending, compared to 26% in the early 1960s. Is this sustainable?
U.S. Government Net Interest Outlays
2017: $335B
2009: $190B
2005: $150B
*Data from CBO
USA National Debt 2009-16
It’s pure comedy to listen to the national media in the U.S. talking up the risk of a Donald Trump Presidency to the National Debt. Debt has exploded under Obama and Congressional policies since 2008.
Get our latest trade ideas heading into the 2016 election here;
Our Best Ideas await you, Get on the Bear Traps Report Today, click here

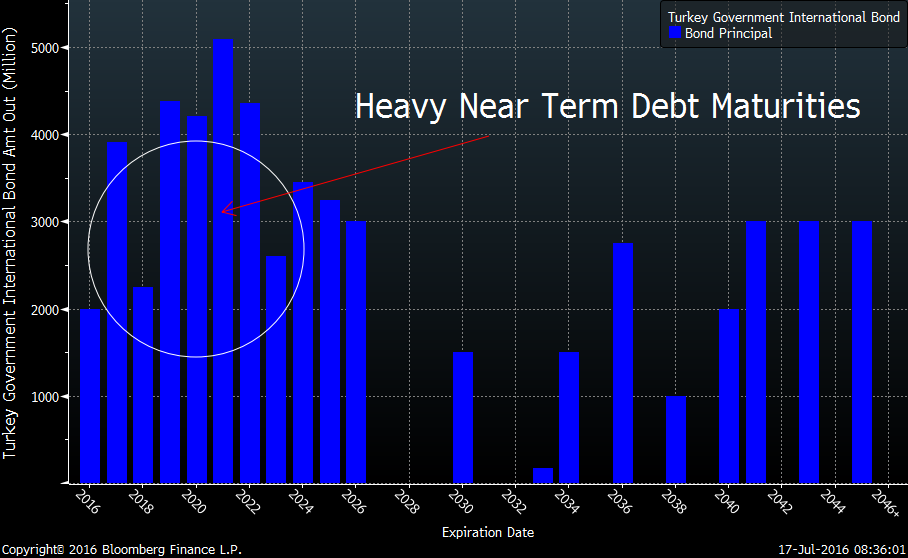 Nearly $60B of total government debt, but near term maturities are on the heavy side for Turkey.
 Turkey’s 5 Year CDS made a strange reversal this morning, then closed for the day.